This is my loli pop chart and I got it from a regular bar chart by playing with the borders and adding arrows. This type of graph is similar to a bar chart so its best used whenever a bar chart is best used. Usually for looking at linear data
Home » Uncategorized » Loli Pop Chart
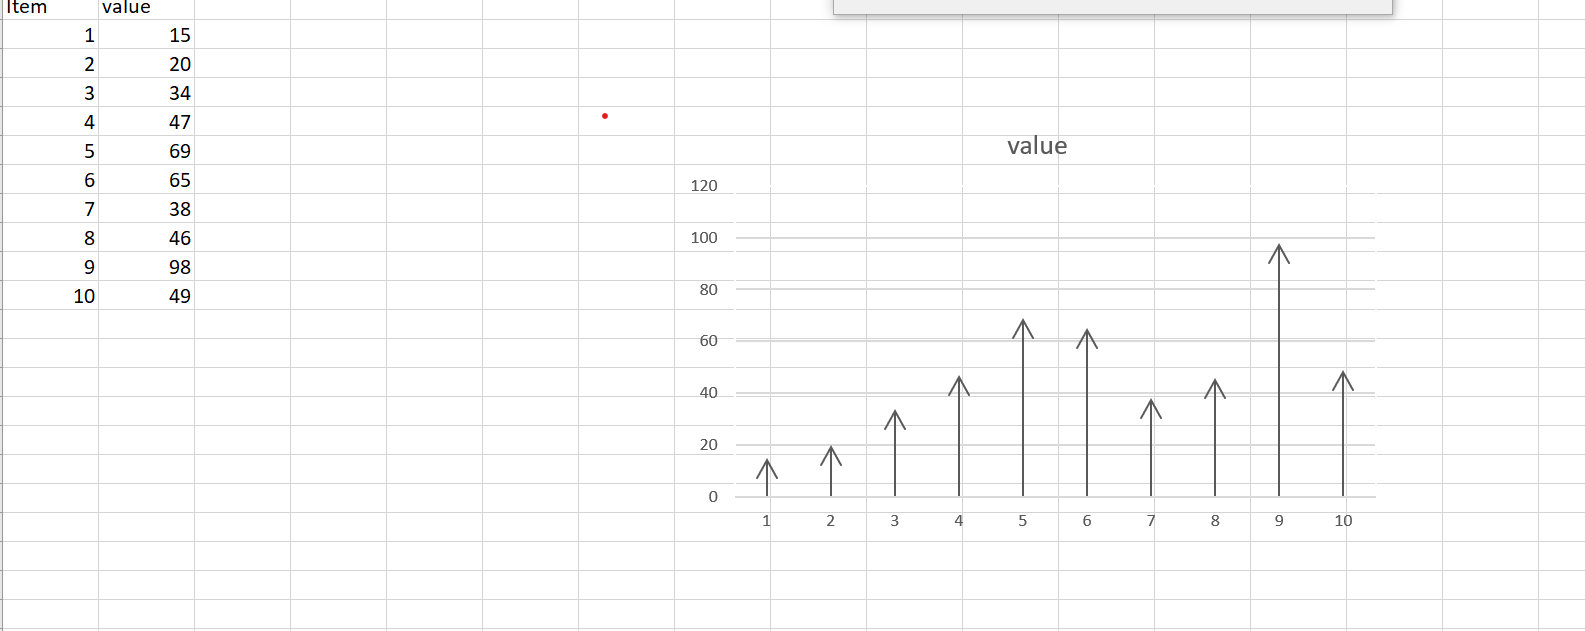
This is my loli pop chart and I got it from a regular bar chart by playing with the borders and adding arrows. This type of graph is similar to a bar chart so its best used whenever a bar chart is best used. Usually for looking at linear data
Recent Comments