Pie charts are used to represent the proportional data or relative data in a single chart. The concept of pie slices is used to show the percentage of a particular data from the whole pie. Making them different colors can help the reader to differentiate each result. Pie charts show the proportion of the whole that is taken by various parts.
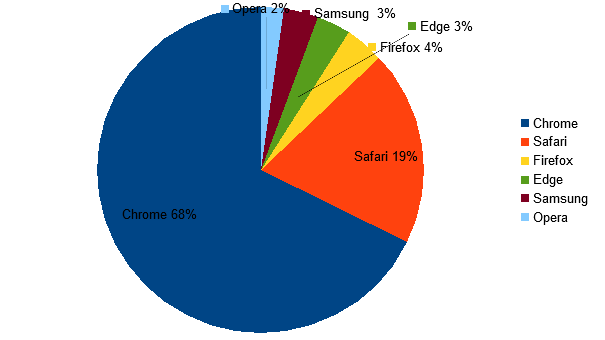
I favor this pie chart because a couple years back, when Chrome was still getting on its feet safari and internet explorer were the top browsers.