When dealing with large amounts of data, it is often times difficult to organize and visualize everything in a manner that effectively arranges the data to communicate a clear message to the viewer. However, a very useful tool that can help in this situation is the pivot table. Pivot tables are best used to aggregate various values from a larger subset of values into a compact yet versatile table. Typically, they are also interactive with the ability to add or remove different categories or values to fit the needs of any given situation.
Uses
Pivot tables are often used in businesses to organize and present sets of data such as sales and inventory reports where there are hundreds and sometimes thousands of values that fall under many different categories.
Example
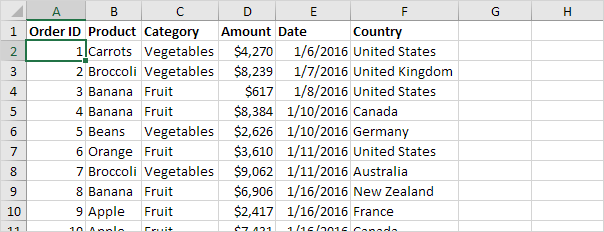
This data set consists of 213 records and 6 fields or categories. With the use of a pivot table, all of this data can be compressed into a more organized and readable format .
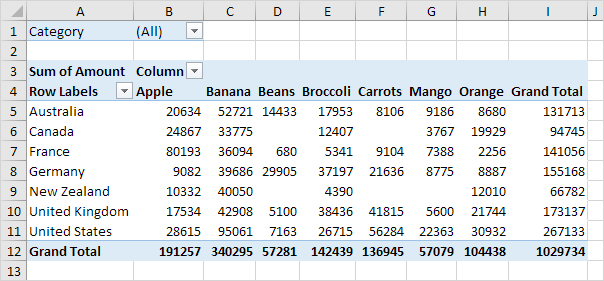
Now, all of the raw data is much easier to analyze through this pivot table that shows grand totals for each product, by location, as well as an overall total. While this is a very useful overview of the data, sometimes visualizing the entire data set can be excessive or simply unneeded. In this case, pivot tables really show their versatility with the option to filter the data to just the right specifications depending on what is needed.
Filters
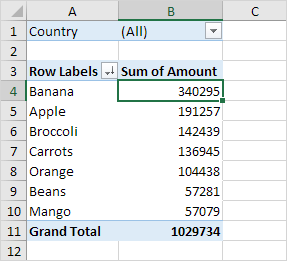
In this example, the data from above is sorted by all locations and the totals for each product.
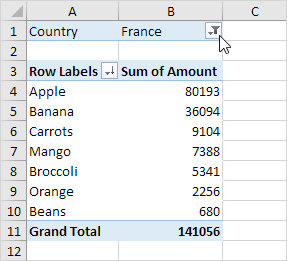
In this example, the data is filtered further to only present the totals for each product in the country of France.
Recent Comments