The beauty of a lollipop chart is its ability to convey data in a slick and spacious format. Compared to a bar graph and column chart, the amount of space allows you to add details that would be too immoderate for any of the previous charts mentioned.
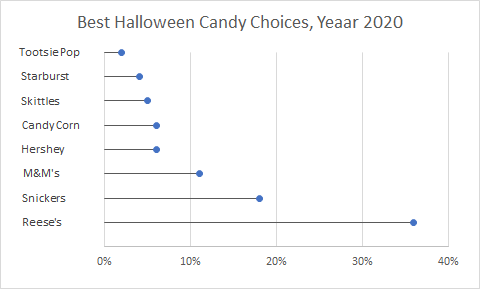
Take this chart for the most popular Halloween Candy surveyed in 2020; the amount of detail can be easily understood and more importantly, is visually pleasing. Each amount of candy can be understood without an actual percentage just by looking at the range and as people say, ‘less is more.’
Recent Comments