Spreadsheets can be intimidating. Although simple data sets may be more common, sometimes, there’s no way to prevent them from becoming complex as more columns and rows are added to accommodate additional information. To combat this, spreadsheet applications offer the option to include “Pivot Tables”.
A PivotTable is a powerful tool to calculate, summarize, and analyze data that lets you see comparisons, patterns, and trends in your data.
Retrieved from : support.microsoft.com.
In addition to providing basic instructions for a number of different spreadsheet applications, Lumeer mentions several uses for Pivot Tables. Throughout each example, however, it is evident how well the tool works at making otherwise convoluted data more intelligible.

In this example, the original data set is altered to show the total sale amount of each salesperson across the timespan the data was collected from. This is only one possible adaptation of the data, however. If the sales amount by month is preferred, a different Pivot Table would fit the bill.
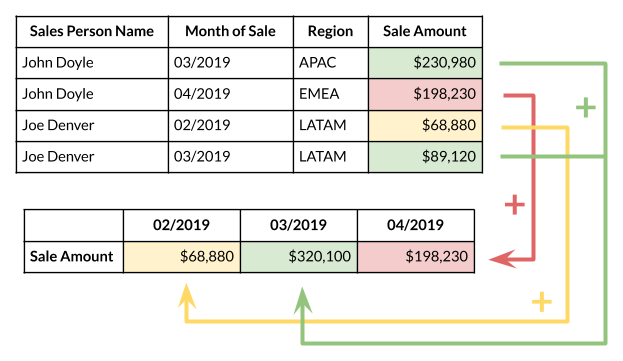
Depending on what factors a Pivot Table takes into consideration, the same data set can yield a multitude of different stories. While it may be a cliché to suggest that the possibilities are endless, that is exactly the appeal and purpose of Pivot Tables. With their help, any element can be added to a data set and be presented concisely.

In this spreadsheet, data spread across 135 cells take factors such as transaction type, method, status, method, and date into consideration. With earlier examples in mind, it is easy to imagine how any number of Pivot Tables can represent the data. By isolating desired information, they are an invaluable tool for displaying and sharing data in ways that are more effective than the original table on its own.
Recent Comments