Pivot Tables are an easy and extremely useful feature in Excel that allows for the extraction of significant information from large detailed data sets. It allows for the users to quickly convert data into smaller easier to understand sets to help them complete their work.
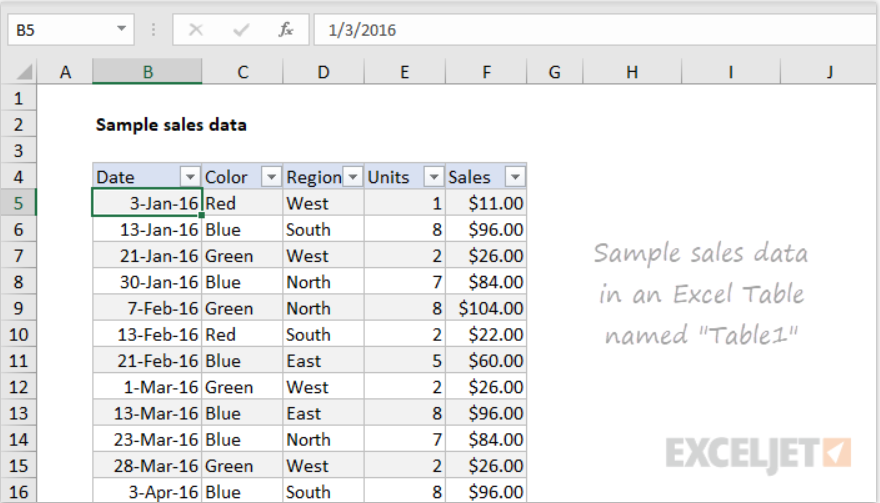
In this example, you can see the different entries in regards to color, region, units, and sales. This is a great example of pivot tables because it shows how to organize the data clearly in the main table to aid the viewers in their understanding. This allows for easy comparison between the respective categories to identify trends.
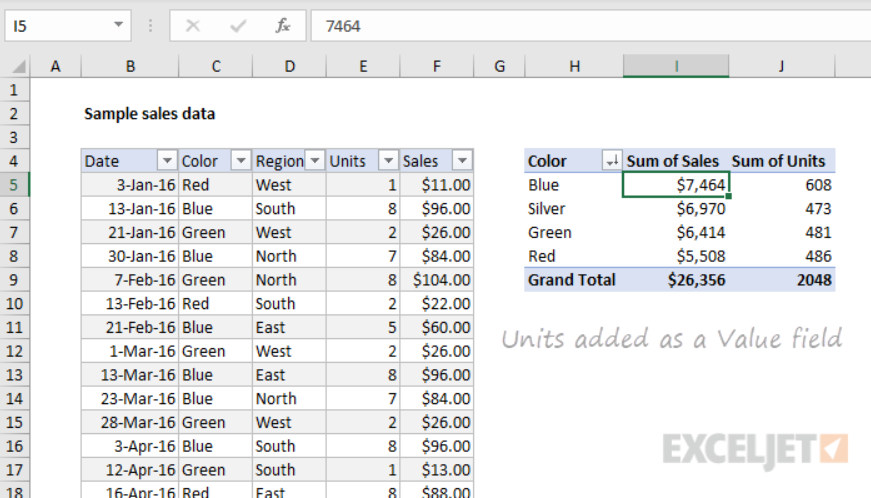
The other pivot charts allow the viewers to sort and manipulate the data in order to make them easier to understand. As you can see the cart identifies the color, sales, and units allowing the viewer to spot trends and compare the overall sales. This is a great tool for any company looking to review its sales.
Recent Comments