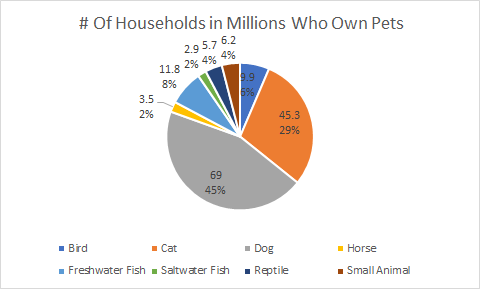
Pie charts are a type of graph that we see often, but not everyone knows how or when to use them properly. Pie charts can become very confusing if they are not labeled properly, or if they have too much data on them. I thought that the perfect case to use a pie chart for was on the types of pets, and how many households own that specific type of pet in the USA. The data I used was from 2019, and it measured the number of households that had specific pets measured in millions. My pet categories included birds, cats. dogs, horses, freshwater fish, saltwater fish, reptiles. and small animals.
Recent Comments