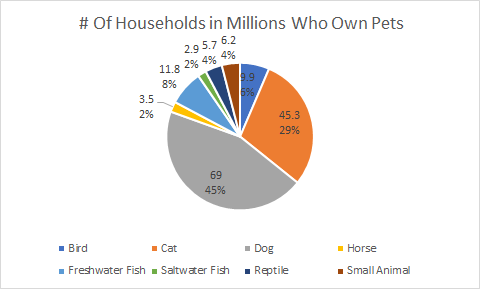
PIE CHARTS
Pie charts are a type of graph that we see often, but not everyone knows how or when to use them properly. Pie charts can become very confusing if they are not labeled properly, or if they have too much data on them. I thought that the perfect case to use a pie chart for was on the types of pets, and how many households own that specific type of pet in the USA. The data I used was from 2019, and it measured the number of households that had specific pets measured in millions. My pet categories included birds, cats. dogs, horses, freshwater fish, saltwater fish, reptiles. and small animals.
Lollipop Charts
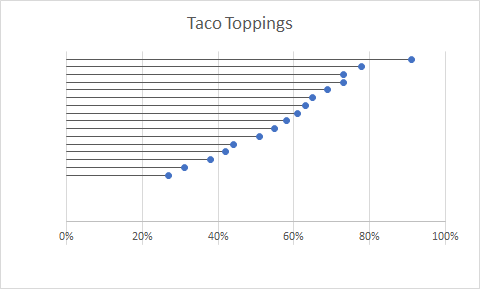
Lollipop charts are very effective at getting data across without having so much information on the chart. It makes it easy for the audience to analyze the data quickly because the lollipops extend showing which item has the highest value. These charts can be very effective for when there is a lot of data to be analyzed. The charts also are very visually appealing compared to other charts. The charts being so clean make them easier to understand compared to other more complicated charts we have gone over in the past.
Visualizing Health
The layout of this website was very interesting. The website is well designed and straightforward to use. It helps health professionals get health risks across to the public using visualizations. The visualizations have been tested to prove they are effective at getting information across.
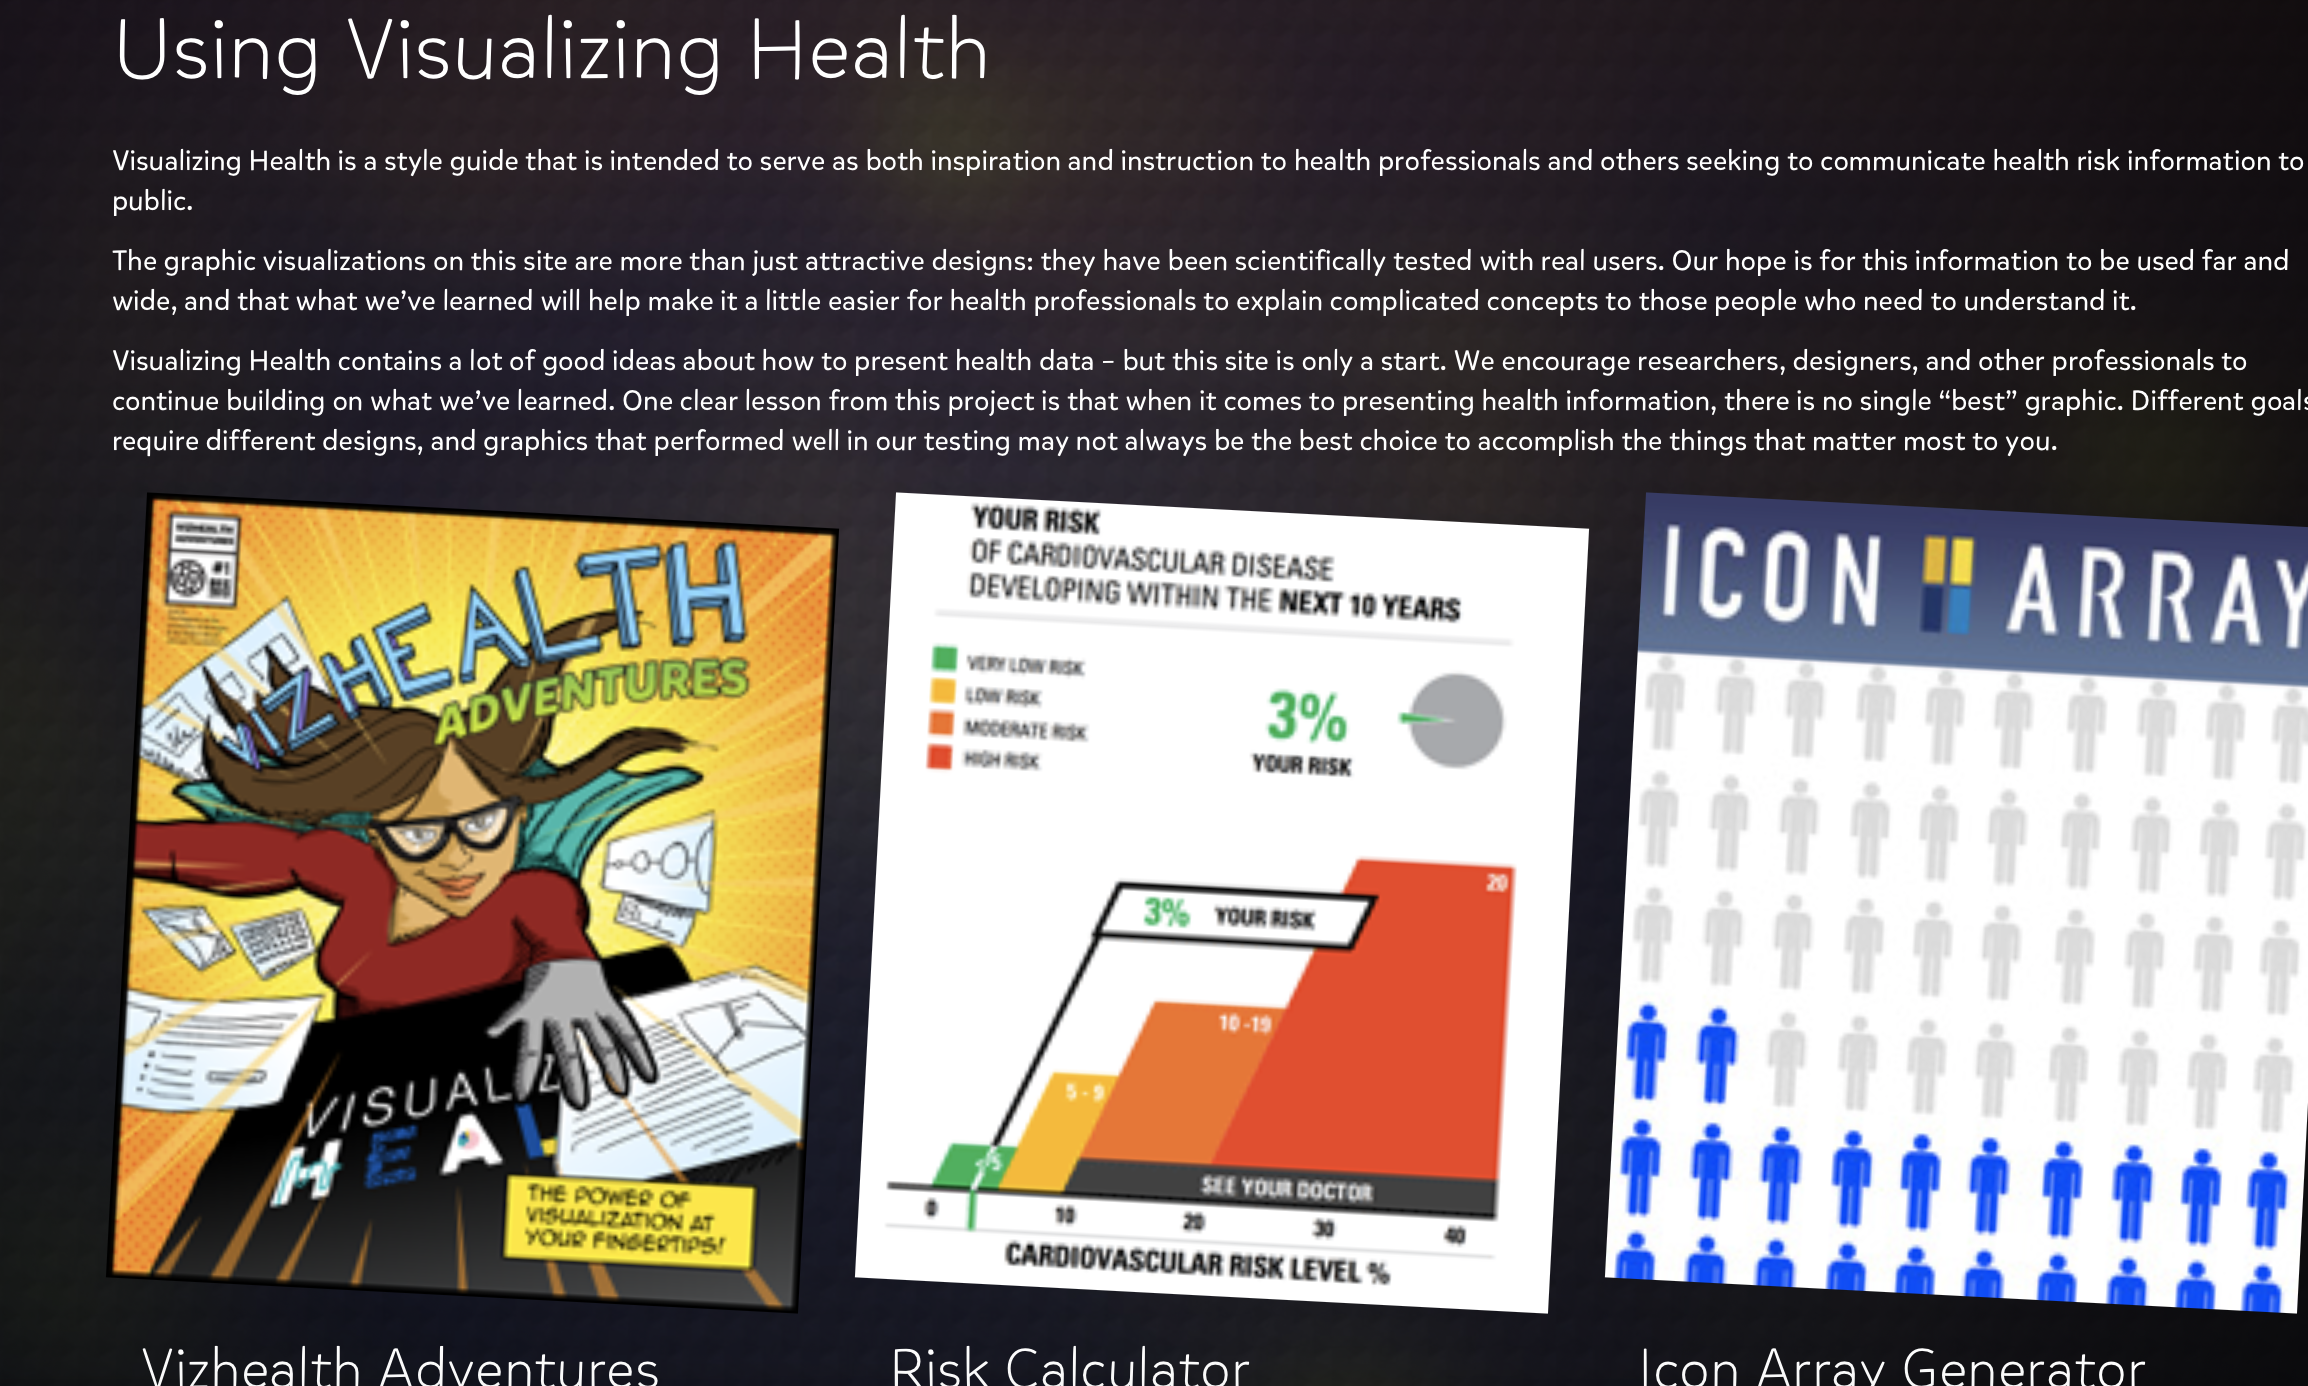
The visualizations included on this page were very appealing visually. Not only that, they also were easy to understand and contained relevant information. This website is a great tool for any one who is interested.
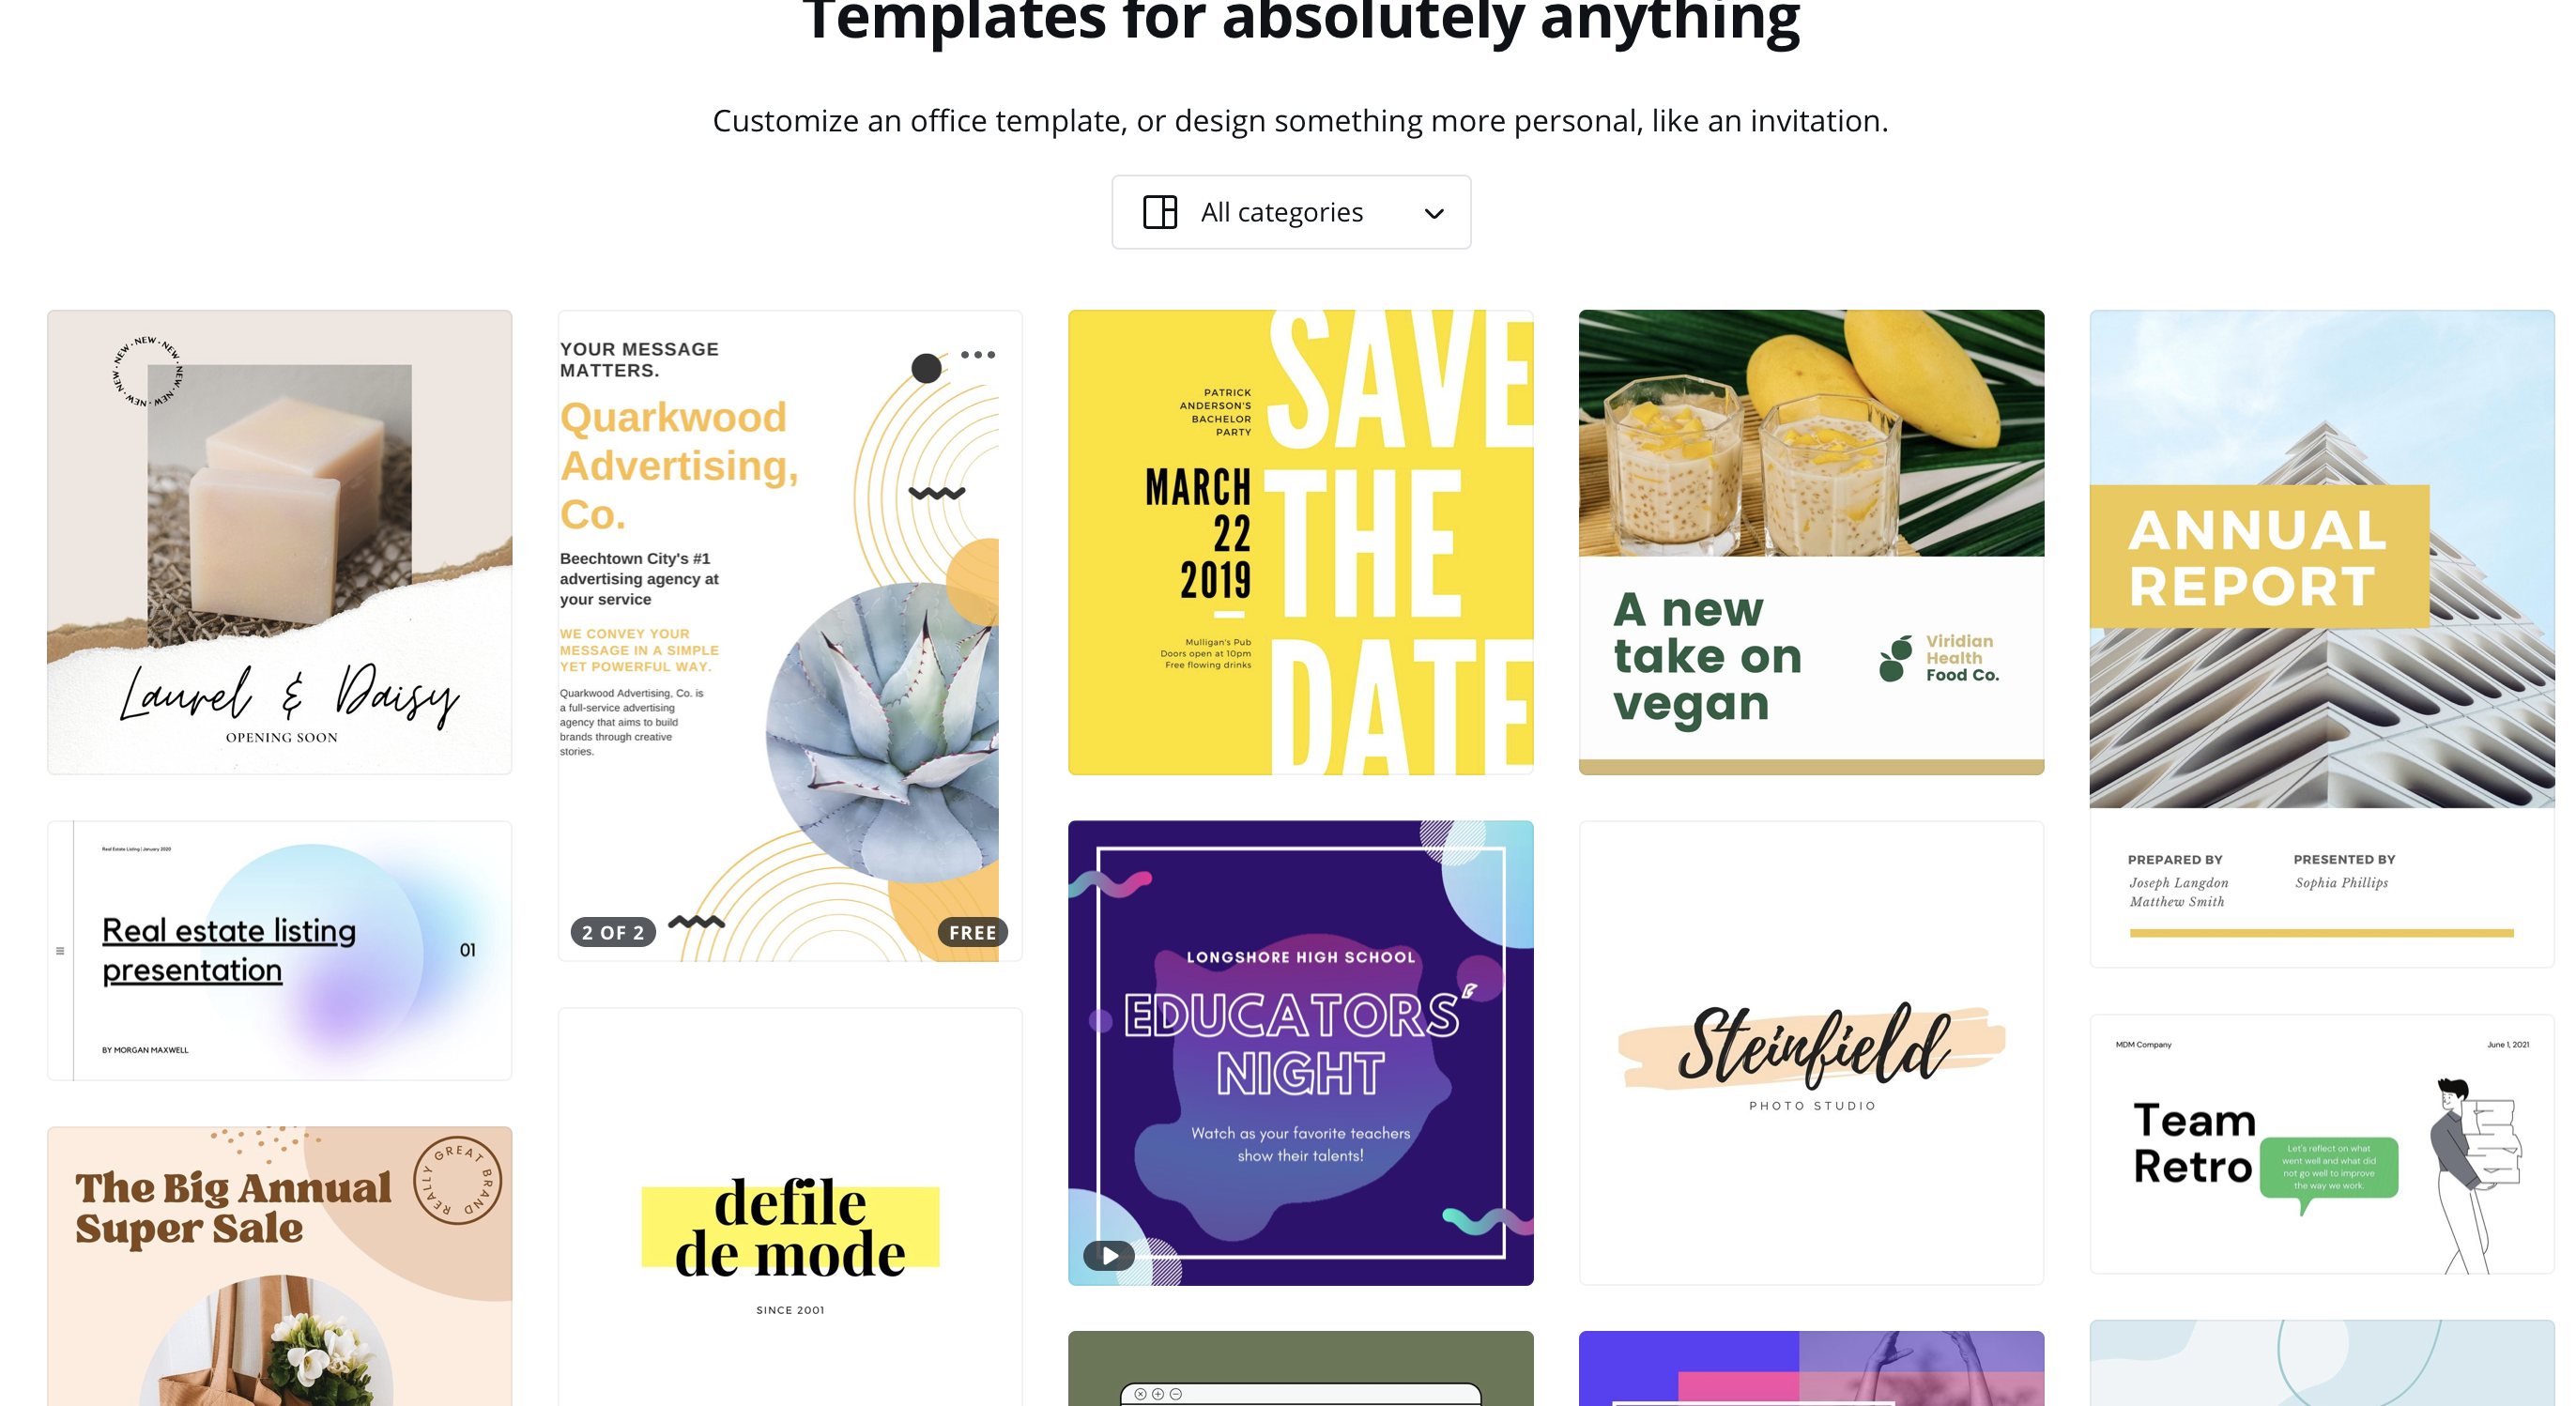
Tools For Infographics
There are many tools that can be used to make infographics that you can find easily online. These tools allow people who do not know much about infographics to make infographics in less than an hour. These tools give you layouts and make creating an infographic super easy. The tool that I found that seems to be the most popular and easy to use is called Canva. Canva is an online infographic tool that is free to use unless you want to upgrade to one of the paid options. The free option of Canva has great reviews and is said to be able to take you very far if you do not know much about infographics. You can find Canva here.
Recent Comments