What is a pivot table?
A pivot table is somewhat like a report, however it gives you an interactive view of the data. It allows use to specifically categorize small portions of data into separate units.
Importance of a Pivot Table?
A pivot table is very useful in excel, it allows an individual too easy and effectively create and organize a wide variety of data. I can be used to create reports and analysis within a large data set.
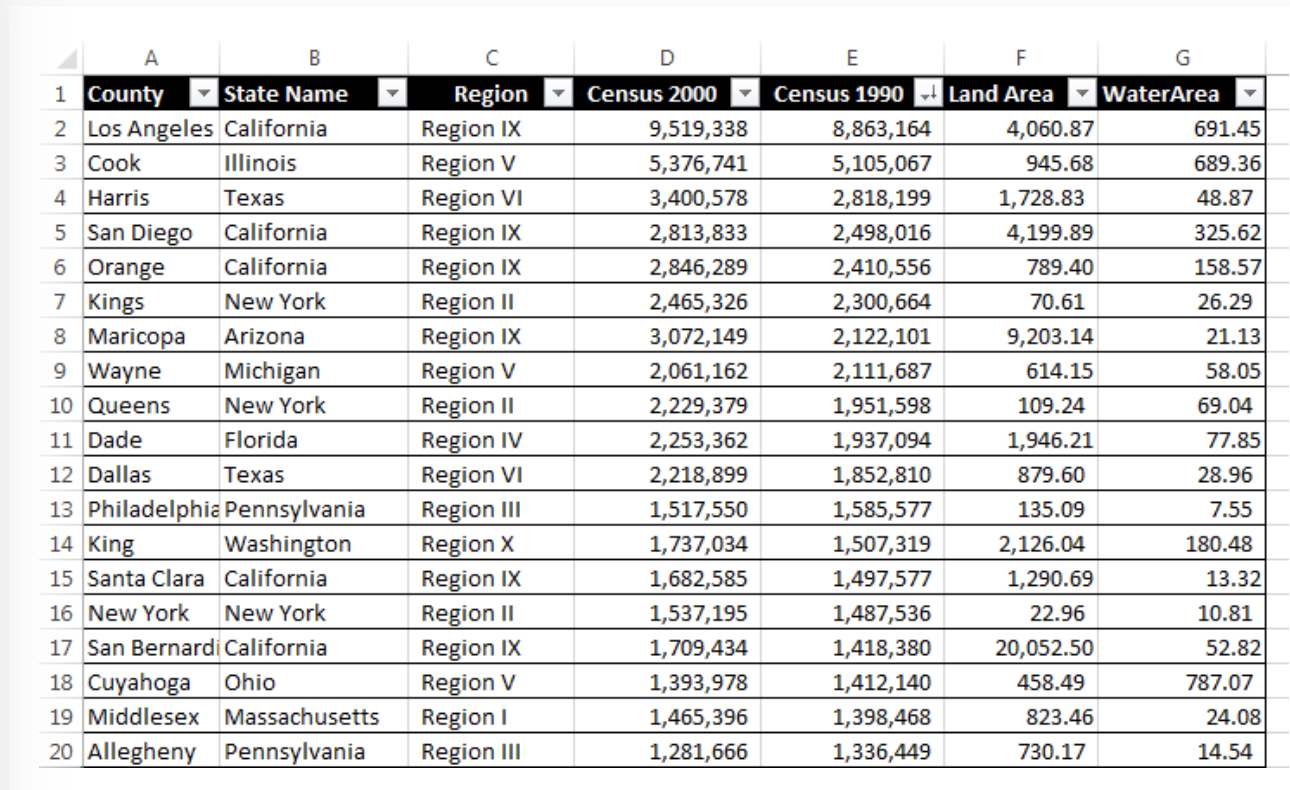
This example pivot table shows various categories of the state and county as a focal point, and then shows the population as well as the square miles of both land and water. This example is a good explanation of how. you can organize and create specific categories to compare side by side while still keeping it in relation to a specific topic in this case it’s the state. As you can see the comparison between census(population) in the 2000’s compared to the. 1990’s.
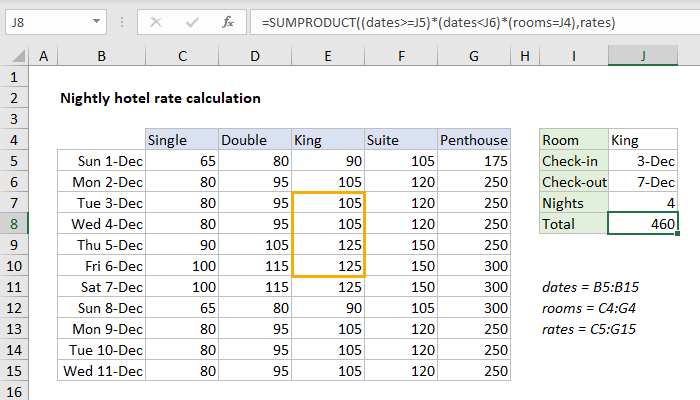
This pivot table is a great example of cost comparison as well as defining them through specific dates within a month. As you can see there are 5 categories defining the specific room type for each date and as the room size gets bigger the price increases. This is a great data set used by hotels, or any company that has packages within their business.
Link to create your own pivot table:
Recent Comments