What is a Pivot Table?
Excel has a neat feature to input different values into one data set called a pivot table. A pivot table can allow you to then make calculations, comparisons, and trends from a large set. Accountants, Data Analysts, and managers of a product/service are occupational examples that may use a pivot table.
Examples
Below is an example of a pivot table in Excel, most likely based upon produce stock.
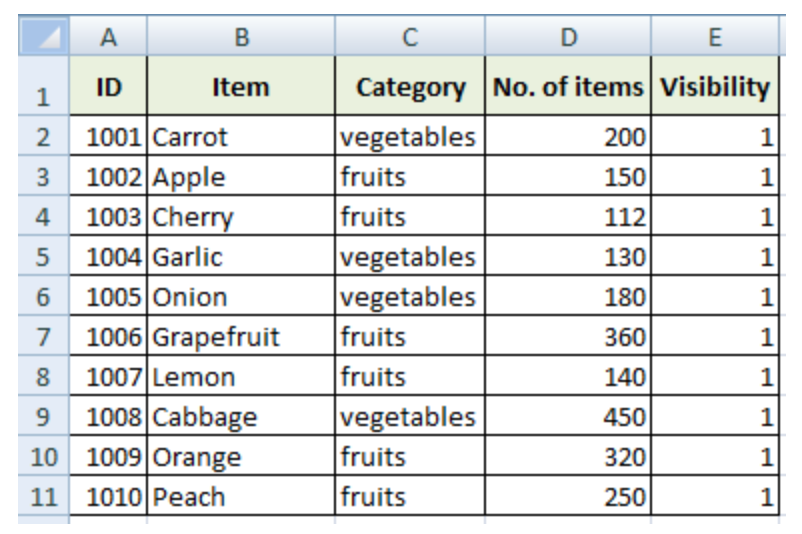
As you can see, there are multiple different categories highlighted in green, which include; ID number, item, type of produce, etc. This is a perfect example of a data set consisting of significant, organized values. Here is another example of a pivot table with an addition to interval of time category.
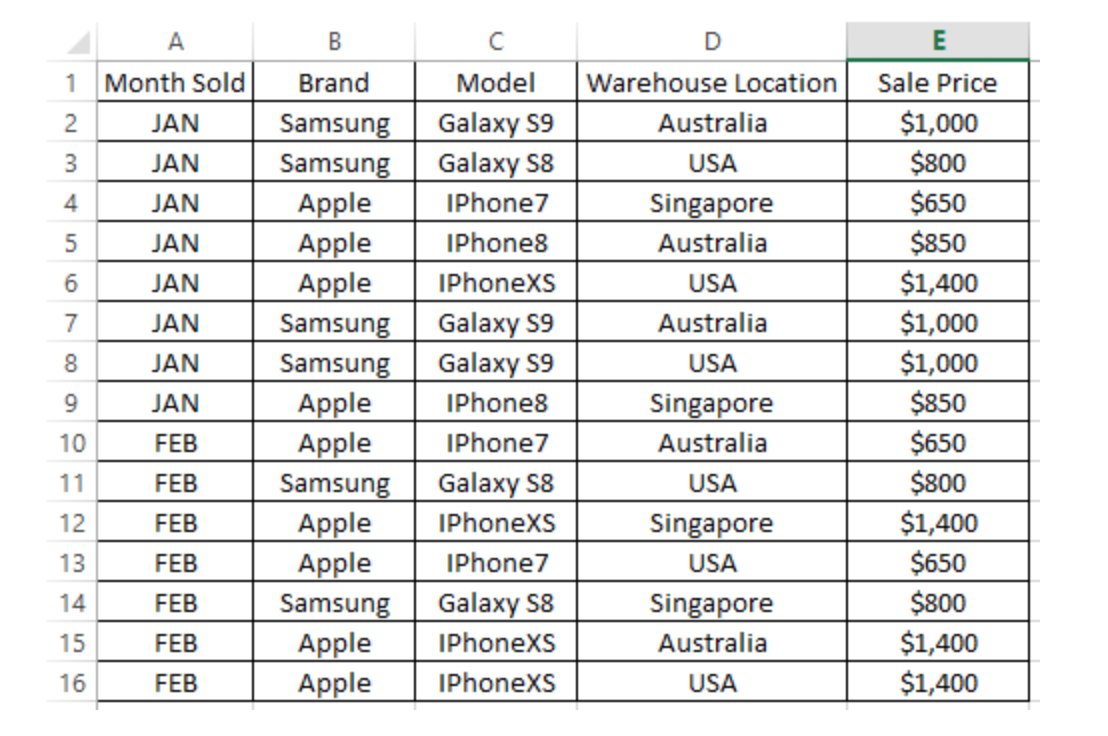
This example is based off two kinds of phones from two different brands. Throughout months of sales for these kinds of phone, plus in different locations, compares then the sales price. Notice how each row breaks down key components for this data example. People are able to compare maybe the prices amongst the different warehouse locations or maybe the Apple IPhone7 sold in U.S from Jan-Feb. Therefore, the business can make an analysis on future sales and/or adjustments to reach success and productivity.
Link to Create Your Own Pivot Table
Recent Comments