
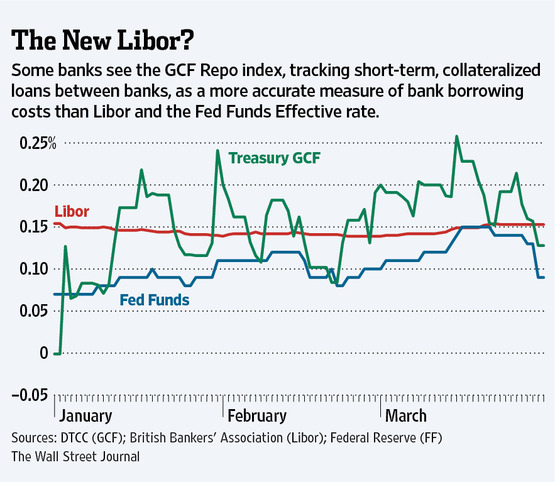
Here above is an example of a line graph from the NewYorkTimes that I found. I will also post another example of a similar but different visual ofthis same graph.
Here is the same type of graph but with a target line in it to show what the average or should be line for the data.
It’s very interesting to see how many ways data can be graphed into these types of graphs/charts. The same type of graph can produce so many different visuals and data representations that it is unreal! Thank you for checking out my blog on this.
Recent Comments