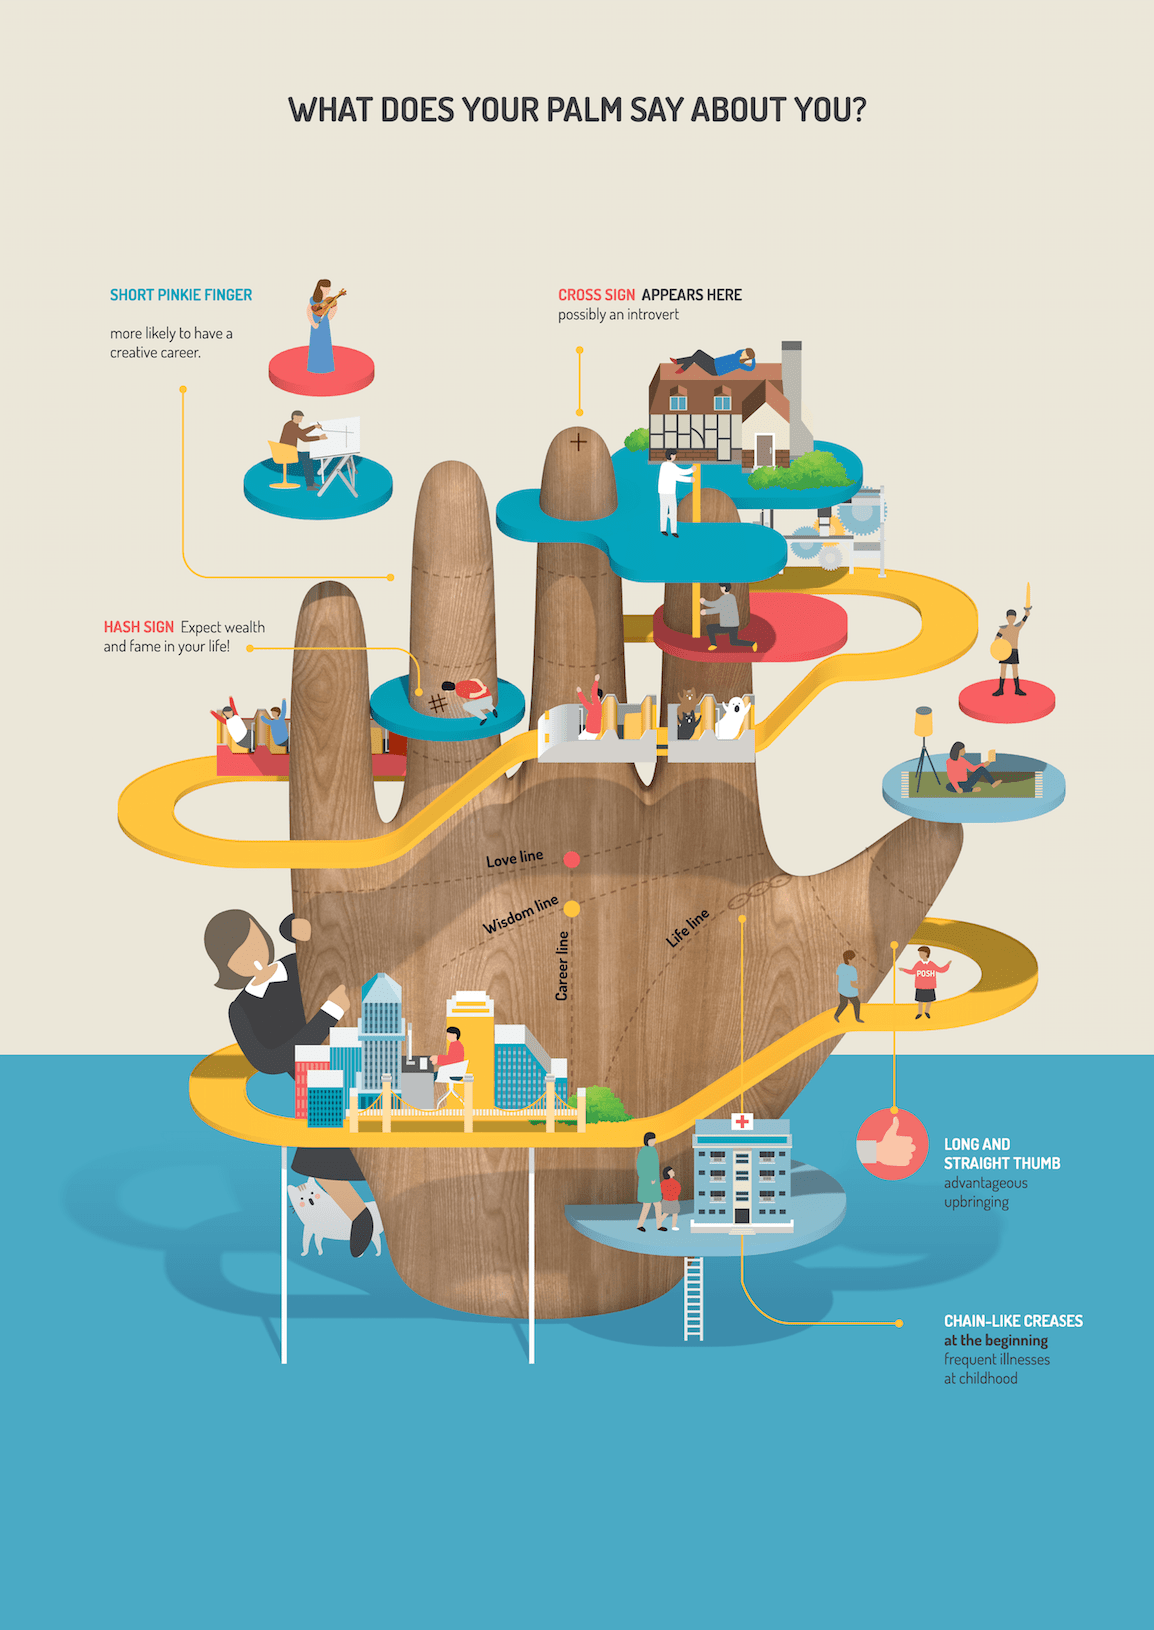
Infographics is a really fun and effective visual way to display any information. Infographics are the visual presentation of information and facts supported by graphics, charts, text, and diagrams. The video in the hyperlink shows how easy you can create a well designed effective infographic about any information. There are a number of tools that you can use to create interesting infographics. Some of those tools are:
Canva- Is a go-to tool for editing and touching up images for different social media platforms. Canva offers hundreds of design elements for creating infographics. They have grids, icons, illustrations, and many charts to represent figures in you info graph.
Piktochart- Is another infographic maker that can create interesting infographics. With Piktochart, you can create interactive charts, maps, and graphs. All you have to do is import your numbers, choose the chart or map you want to use for your infographic and you’re done.

Recent Comments