Pivot Tables
What is a pivot table?
A pivot table is somewhat like a report, however it gives you an interactive view of the data. It allows use to specifically categorize small portions of data into separate units.
Importance of a Pivot Table?
A pivot table is very useful in excel, it allows an individual too easy and effectively create and organize a wide variety of data. I can be used to create reports and analysis within a large data set.
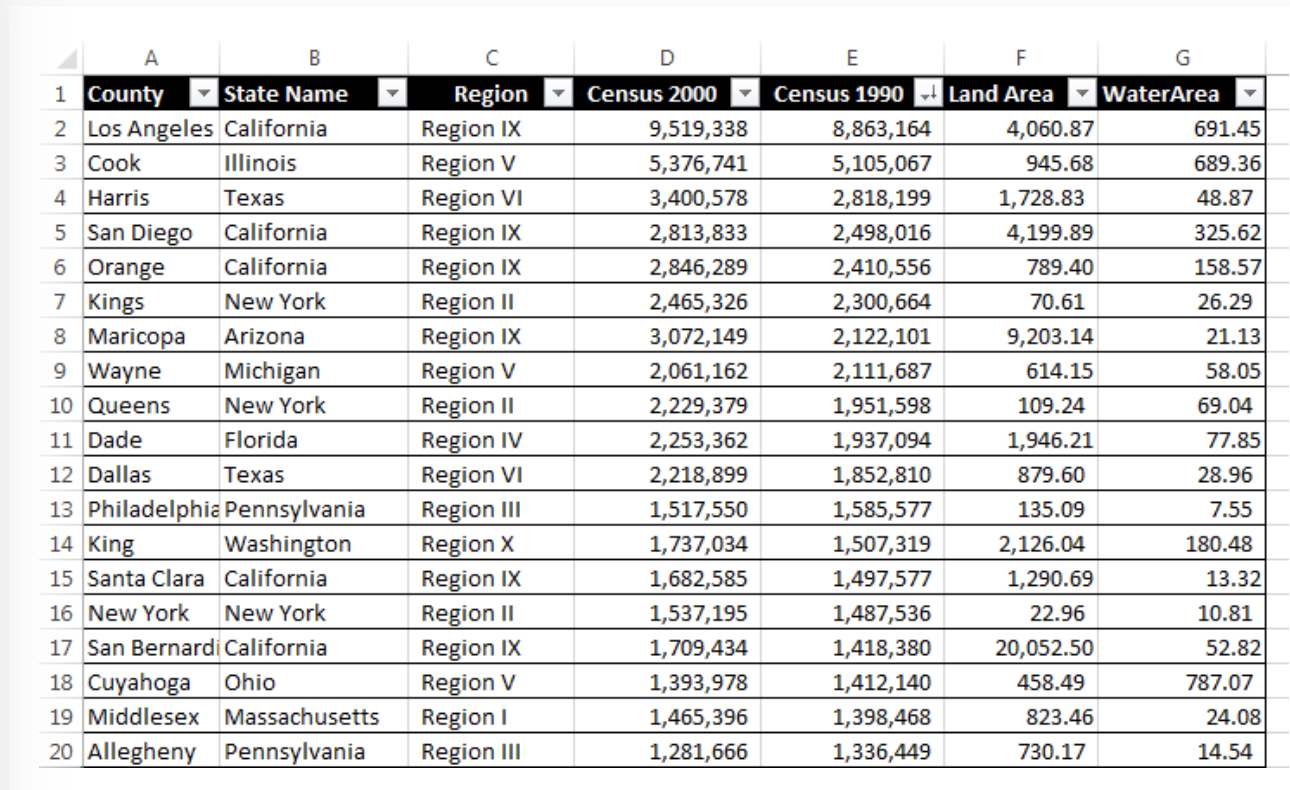
This example pivot table shows various categories of the state and county as a focal point, and then shows the population as well as the square miles of both land and water. This example is a good explanation of how. you can organize and create specific categories to compare side by side while still keeping it in relation to a specific topic in this case it’s the state. As you can see the comparison between census(population) in the 2000’s compared to the. 1990’s.
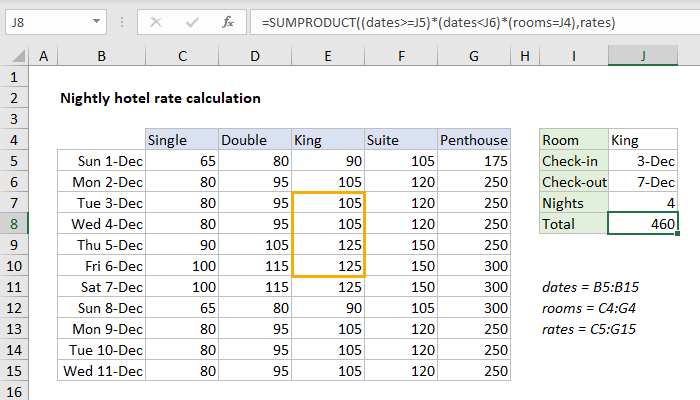
This pivot table is a great example of cost comparison as well as defining them through specific dates within a month. As you can see there are 5 categories defining the specific room type for each date and as the room size gets bigger the price increases. This is a great data set used by hotels, or any company that has packages within their business.
Link to create your own pivot table:
Pivot Table
The main purpose of a pivot table is to summarize data in a quick and concise manner. The function of these is very important because they can turn boring excessive data into clear and concise data. This can allow the user to make quick decisions based on the data which makes it a great tool in the industrial world. One example I have found shows how it can be used in the political world. This second website I found has a plethora of examples and uses that can be very useful for people wanting to learn about their uses.
Pivot Tables
After reviewing the link on www.contextures.com,
I found useful information to assist me in trying to format a organized pivot table. In excel, pivot tables are known to be the most powerful, useful, and beneficial for large data sets. They summarize, sort, and organize information in tables that are easily adjustable. They allow you to interact and explore data in different ways and look at the same data with different perspectives.
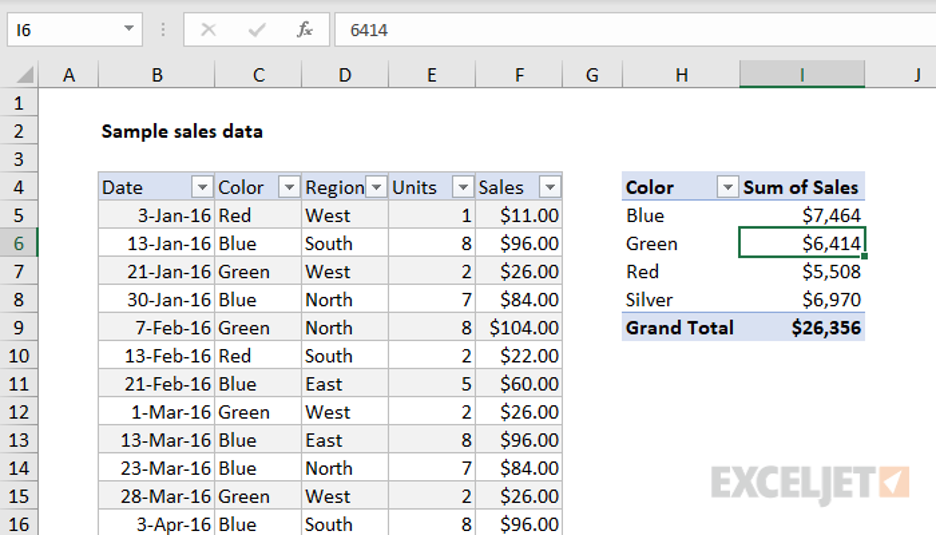
An example of a sales data set, from ExcelJet includes a pivot table that is easy for adjustments because in this case data changes frequently. There are many other benefits to using Pivot Tables, they are easily changeable or flexible. They are accurate, take less time, and you can create pivot charts from the pivot table.
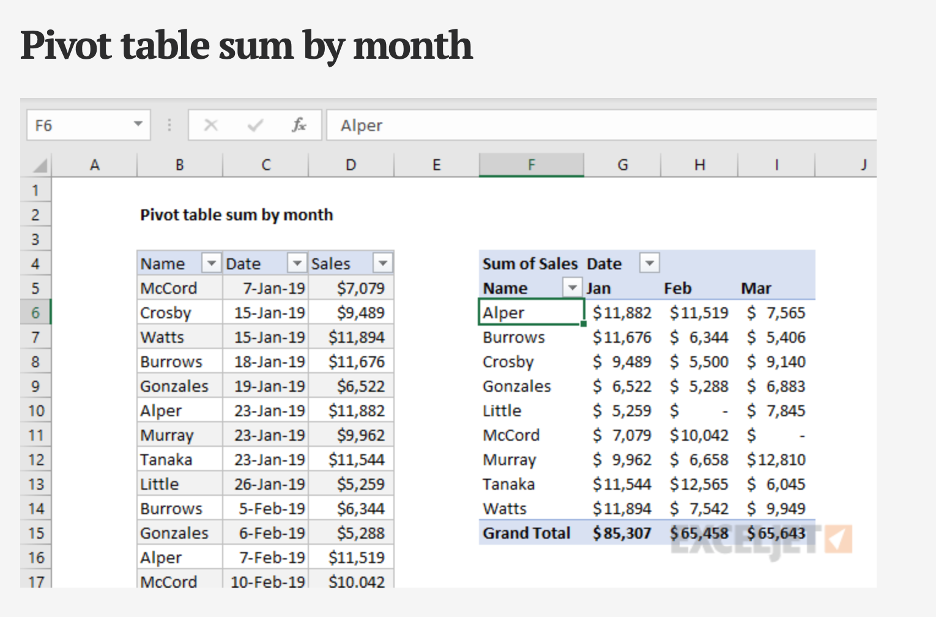
With pivot tables there are many ways to summarize and group data, for example the pivot table sum by the month using the data grouping feature on excel.
Recent Comments