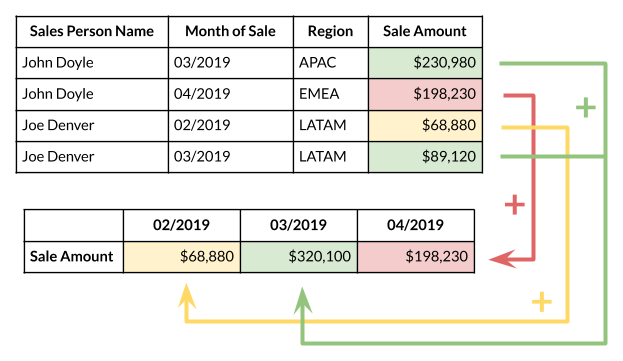
A Pivot Table is used to summarize, sort, reorganize, group, count, total or average data stored in a table. It allows us to transform columns into rows and rows into columns. It allows grouping by any field (column), and using advanced calculations on them. They give us the ability to get a summary or recap of the data rather than scrolling down to find each subtotal.
Here are some examples of Pivot Tables.


An important advantage of pivot tables is that it is easy to use. You can easily summarize data by dragging the columns to different sections of the table. The columns can also be re-arranged as you wish with the click of a mouse. With the help of excel pivot tables, you can handle large quantities of data in one single go. These tables allow you to take a large amount of data and work on it in such a way that you need to view only a few data fields. This helps in the easy analysis of large amount of data.
Recent Comments