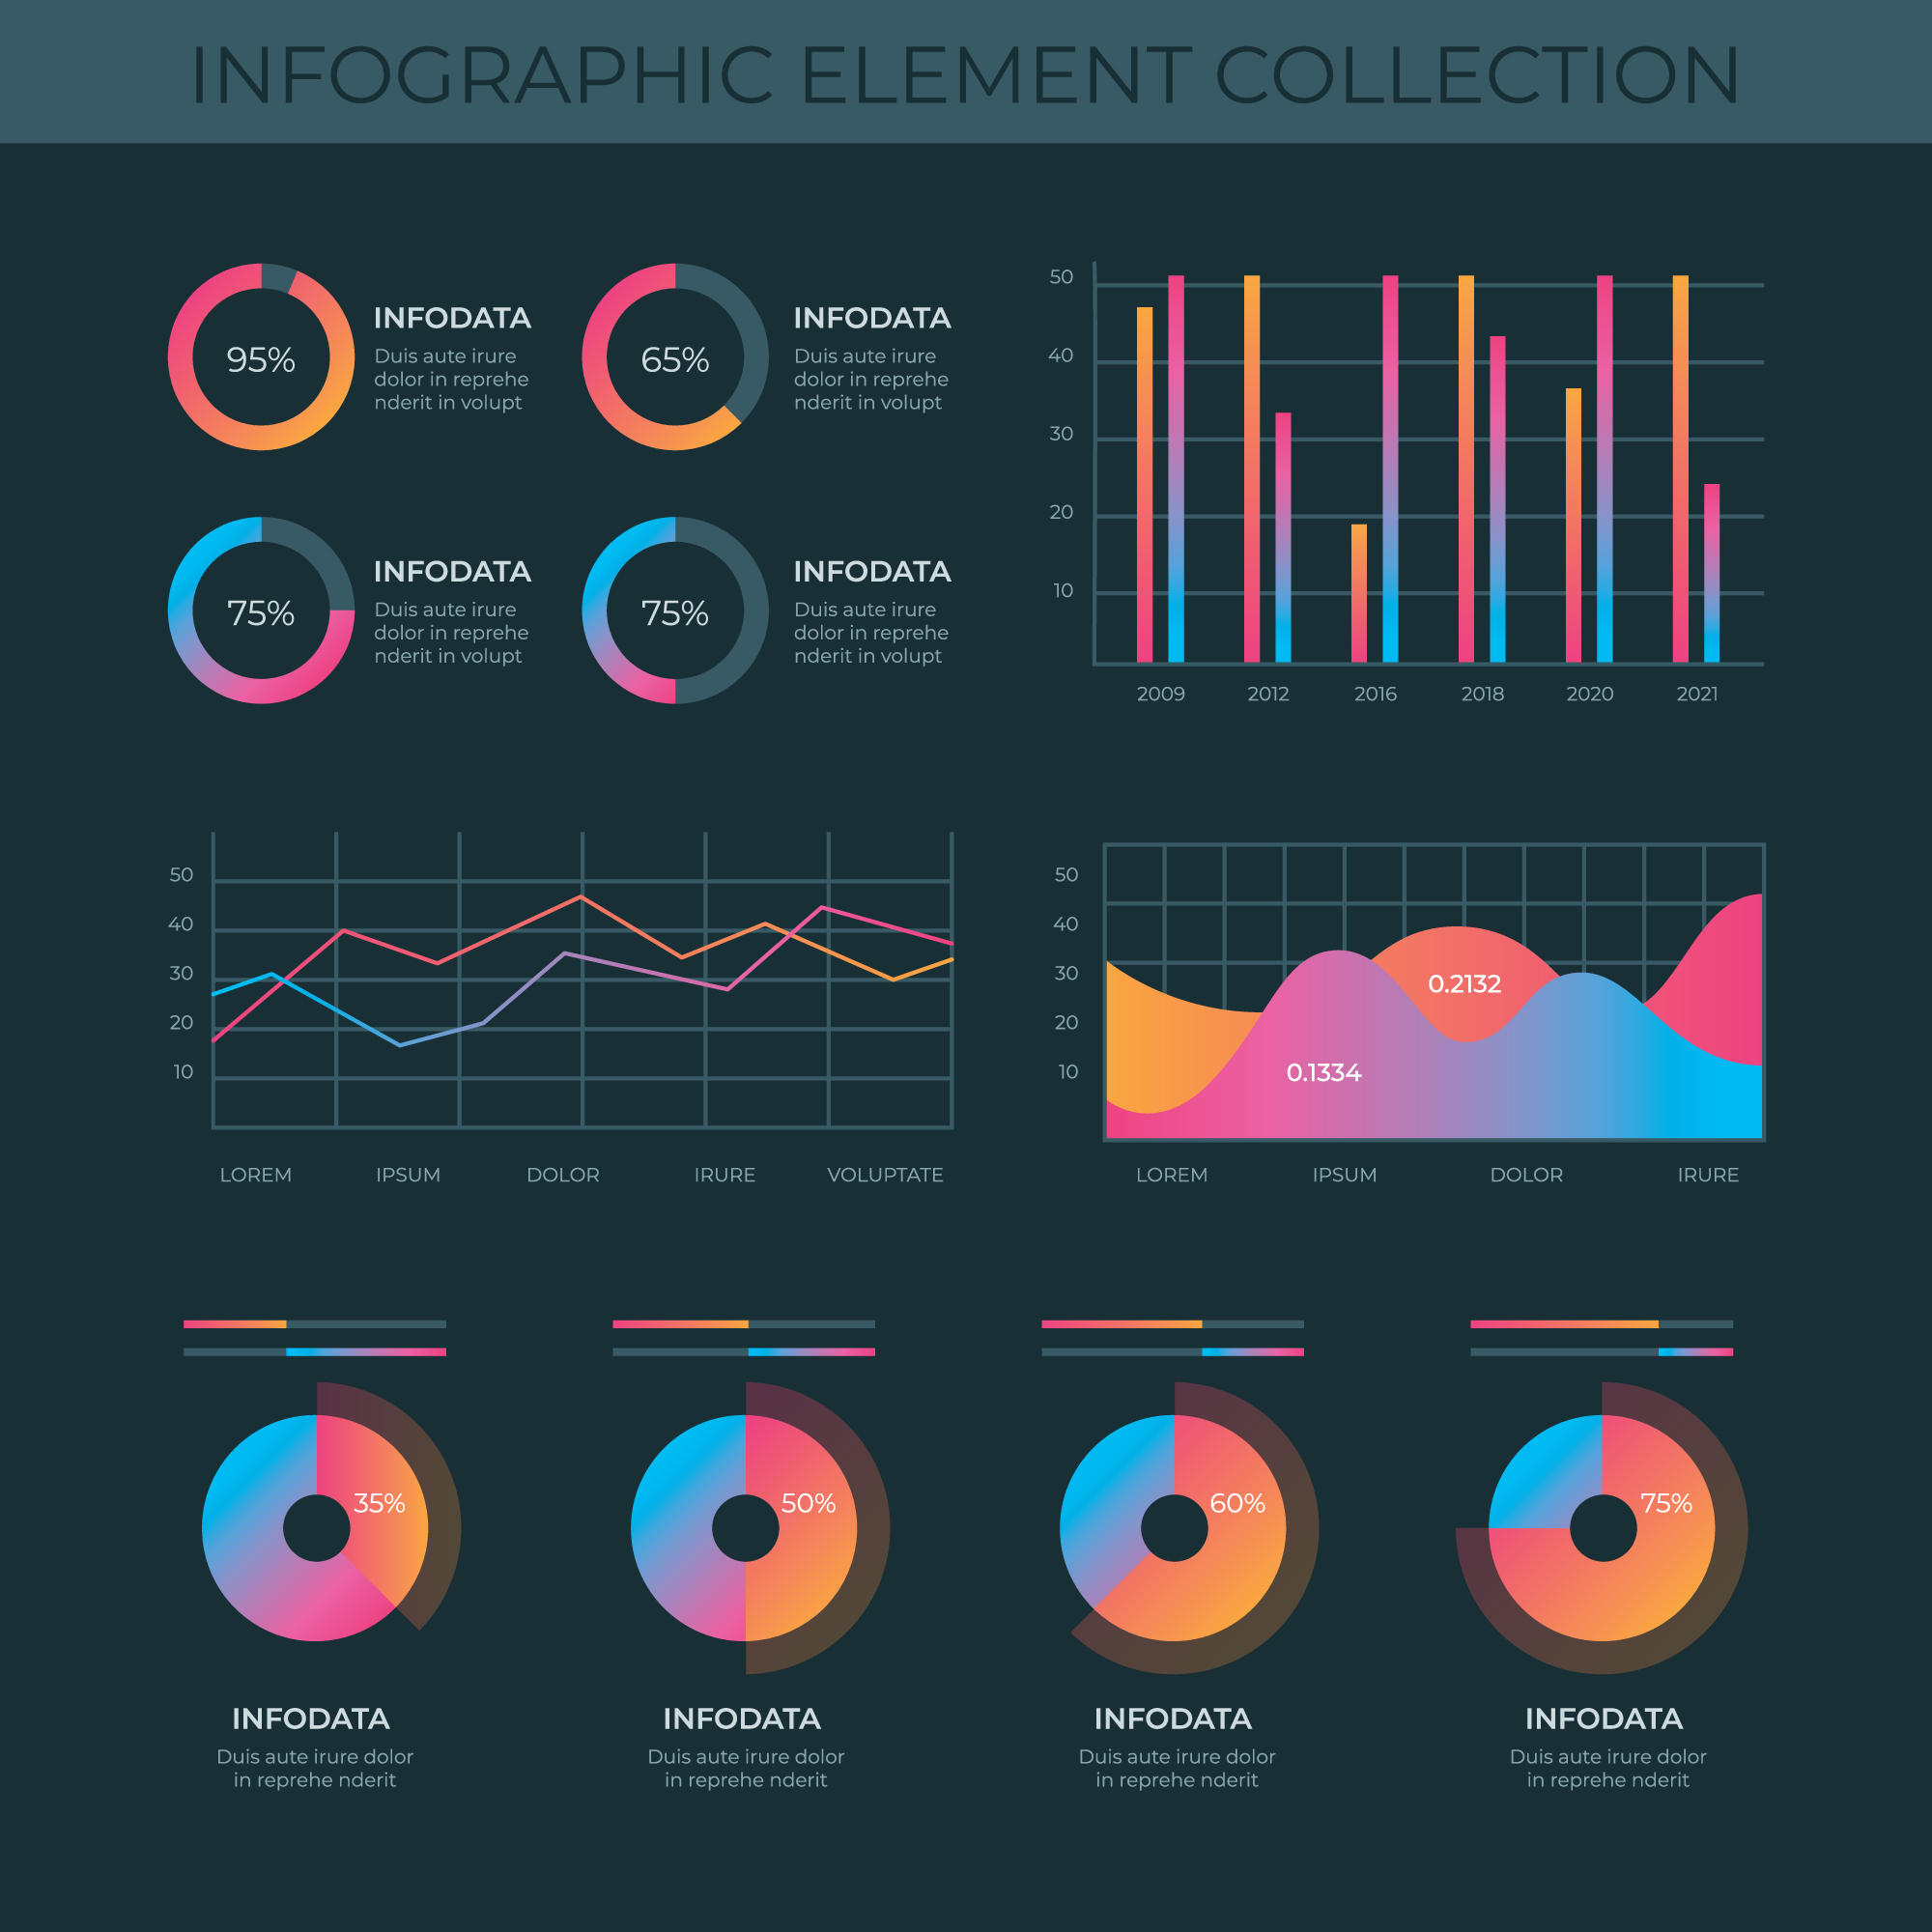
Examples of data visualizations. 1 – Cinema: Explaining a movie plot through data visualization. 2 – Art: Analyzing the color palettes of great artworks. 3 – Philosophy: A visual depiction of ideas. 4 – National Geographic: Cartography. 5 – Gastronomy in pictures. 6 – Data visualization through video. Below is a photo of data visualization charts as well as a link on the image to the website I got the photo from. Here is also a link to an article I found where they have a lot of great info on data visualization that helped me with this blog. https://www.tableau.com/learn/articles/data-visualization#:~:text=Data%20visualization%20is%20the%20graphical,outliers%2C%20and%20patterns%20in%20data.
Recent Comments