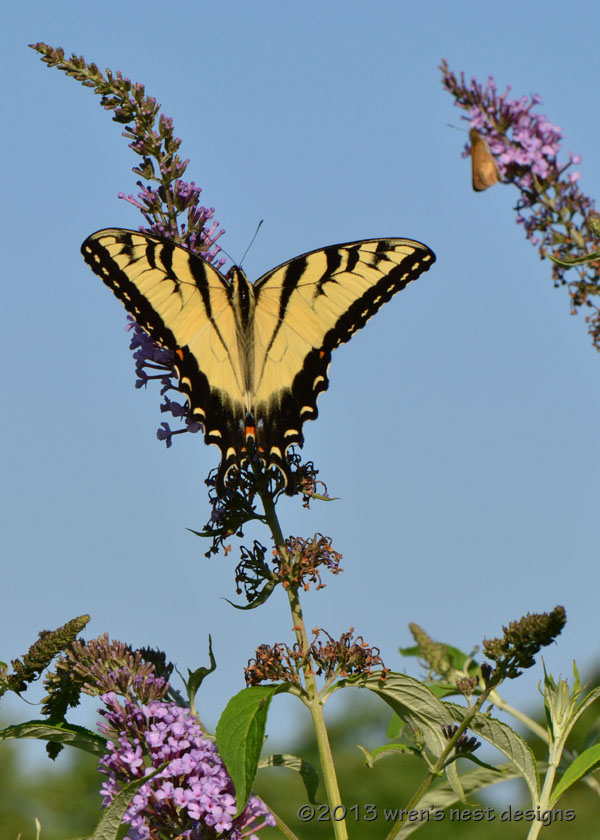
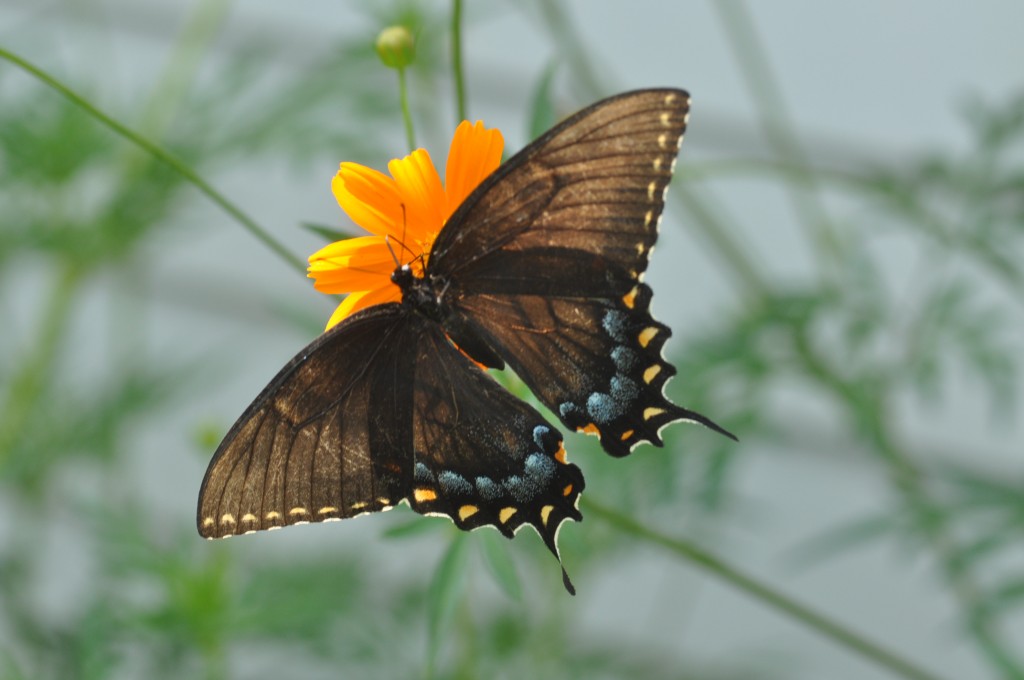
What a show! Our most eye-catching butterfly seems to be flying wherever you look — and in numbers not seen in many years.
We don’t have daily/monthly data going back before our log began, but we do have numbers for the past few years, thanks to all the good work you are doing out there.
So, how does 2013 compare to 2009-2012? (In 2008, our first log year, we used verbal descriptions in the individual totals column — “lots,” “many,” “a few” — so individual counts for that year cannot be compiled, unfortunately).
Our data show that the tiger’s annual sequence is a very regular one — although the peaks and valleys vary in size from year to year.
April: We see the first adults on the wing in the second week in April (early date = 4-8-10). Our log average for the month: 18 reports and a total of approx 31 individuals.
May: Numbers increase in May, as more adults emerge from the chrysalises where they have spent the winter. Our log average: 50 reports, totaling approximately 117 individuals.
June: the numbers generally dip, as the adults from the over-wintering population have mated, laid their eggs, and died off. Log average: 27 reports, 74 individuals.
July: Adult numbers suddenly increase, often enormously, sometimes beginning in late June, as the 2nd brood emerges – and we record far more sighting of multiple individuals. Our average: 64 reports, 255 individuals.
August: August counts have been both higher and lower than July counts. Presumably, we are seeing in August both late-emerging/lingering adults of the 2nd brood and also the first adults emerging from the 3rd brood. Again, the timing and success of both broods (especially the fate of the caterpillars, presumably) probably depends on weather variables and other unpredictable circumstances of each summer season. Log average for the month: 73 reports, 276 individuals.
September: Numbers always drop sharply in September. Presumably, adults of the 2nd brood do not survive long into August, and by mid-September most adults of the 3rd brood have followed them, having mated, laid eggs, and died. Log average: 25 reports, 115 individuals.
October: all adults are gone by the first week of the month. We have had only half a dozen reports for the month and none after October 6 [but see Cynthia Allen’s note in Comments below. South Jersey’s late date — and also apparently the late date of the entire state — is now 10-28-07.]
November-April: The species over-winters in the pupal state.
The graph here of all reports, April 2009 to October 2012, shows this general overall pattern: low in April, up in May, down (generally) in June, up high in July and August, and dropping in September.
Papilio glaucus reports 2009 to 2012
The graph and the averages smooth out the data, of course, and so may be a little misleading. Swallowtail numbers vary significantly from year to year — as every veteran butterflyer knows.
For a “warts-and-all” perspective, see the table below with the raw numbers of all individuals reported for each month since April 2009.
| 2009 | 2010 | 2011 | 2012 | 4-yr avg | 2013 | |
| April |
9 |
72 |
27 |
19 |
~31 |
18 |
| May |
35 |
179 |
137 |
40 |
~117 |
194 |
| June |
11 |
180 |
88 |
16 |
~74 |
191 |
| July |
72 |
518 |
86 |
347 |
~255 |
700+ |
| August |
192 |
456 |
57 |
411 |
~276 |
? |
| September |
10 |
138 |
20 |
291 |
~115 |
? |
| October |
1 |
1 |
0 |
3 |
~1 |
? |
| Year Total |
590 |
1544 |
415 |
1127 |
~869 |
? |
The numbers vary each year, obviously. The April 2009 count was 9; the following April we saw 72, eight times as many. Our July counts have been as low as 72 (in 2009) and as high as 518 (in 2010) – and in July 2013, with still a few days to go, we have already recorded 700+, an order of magnitude more than we found in 2009.
2010 seems closest to the pattern that may be emerging this year. That was the one previous year where the June total matched the May total and the only year when we topped 500 individuals in a single month. One difference: 2010 started with a bang, with our highest total ever for April. In April this year, despite our increased number of participating observers, we found only 18 adult tigers on the wing, our lowest first-month count since 2009. (Perhaps, our rainy June 2013 made especially good foraging for the offspring of those few adults, leading to a higher survival rate for the 2nd brood caterpillars? In any case the 2nd brood outnumbered their first brood parents by a significant margin.)
Will the two months to come follow in 2010’s pattern, with tigers peaking in July and fading in August? Or, will they continue to increase in August as they did in August 2009 and August 2012? In that case, 2013 will end as a truly spectacular year for the species.
Stay tuned, everyone! And keep reporting what you see!
jc


Cynthia Allen has noted that in 2007, the year before our log got started….
“I had an exceptionally late Eastern Tiger Swallowtail on October 28, 2007. I shared the sighting with Pat [Sutton] who in turn shared it with Dale Schweitzer and David Wright. Consensus opinion was that the E. Tiger emerged from its chrysalis prematurely, when it should have wintered over. October of 2007 was about 10 degrees above normal. The latest date for E. Tiger that I found from Pat’s CMBO Natural History Hotline was October 1.”
Could that 10/28 be the state record late date for this species? The latest date I see listed on North Jersey NABA’s new website is 10/11.
jc