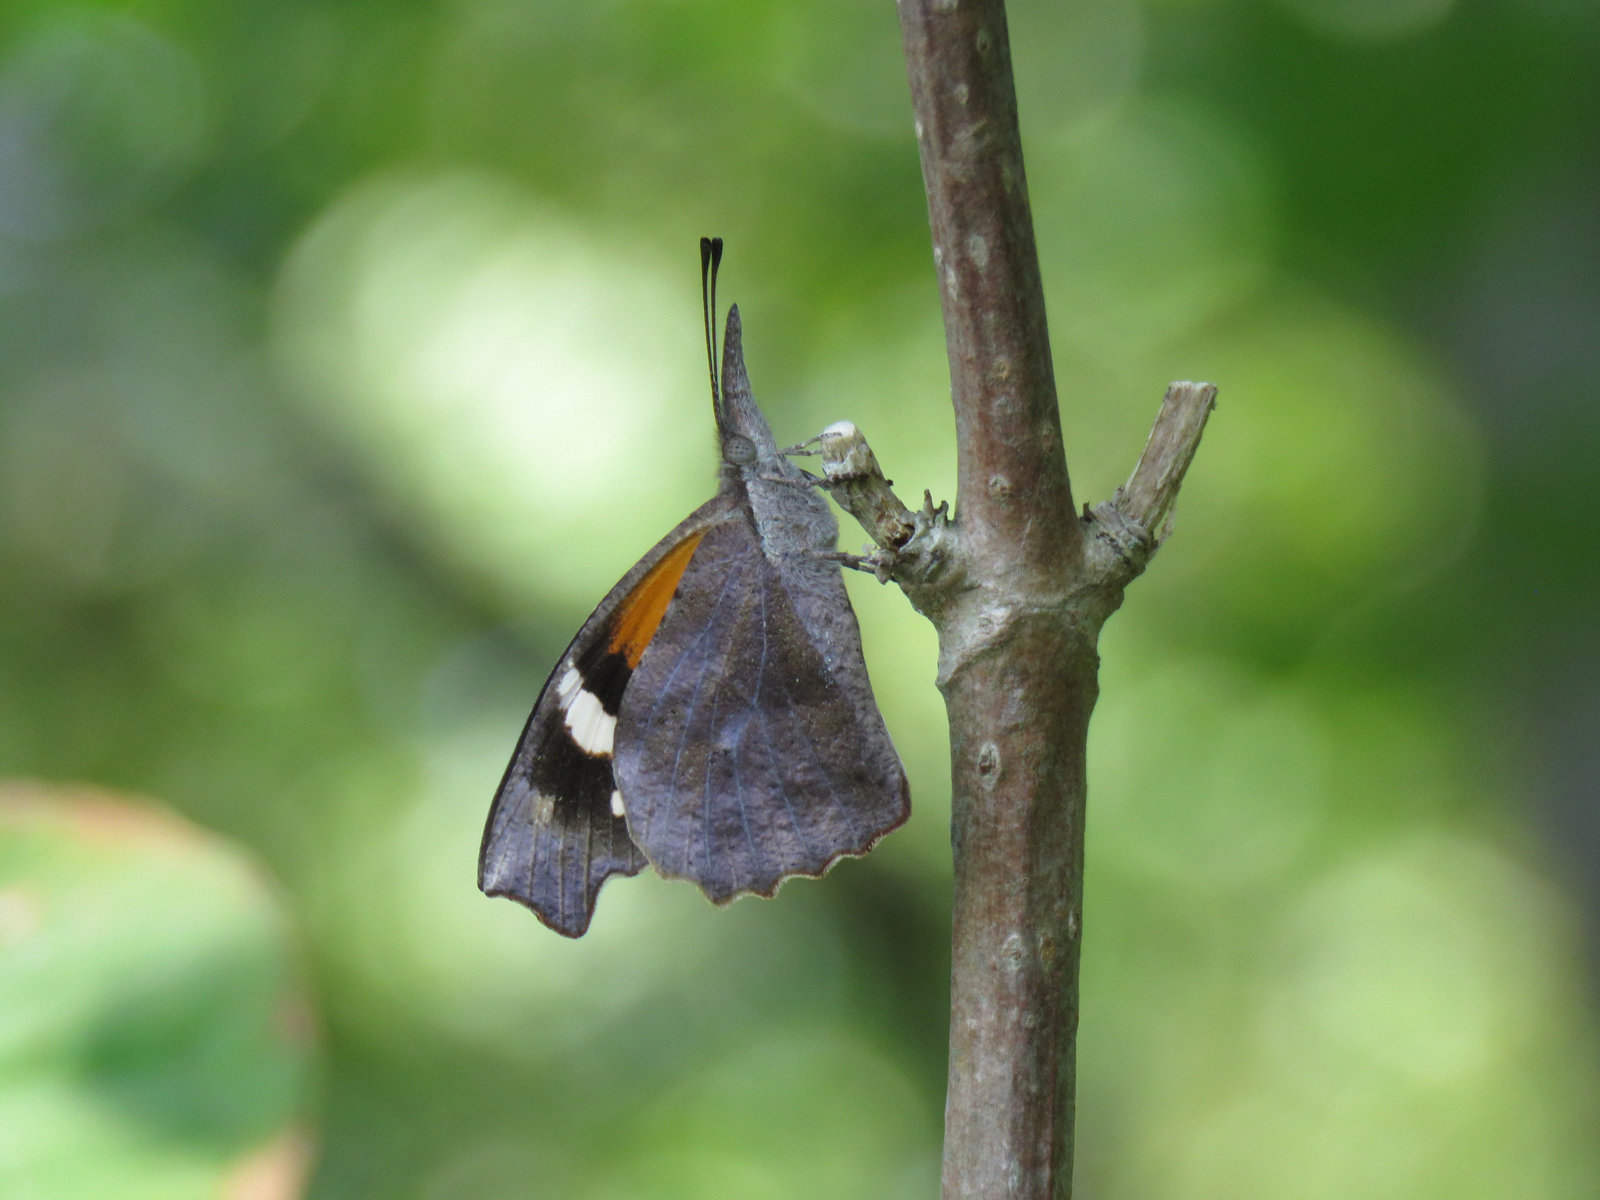
American snout had stellar years in 2019 and 2020 — doubling its ten-year averages in both reports and total individuals. Brenda Bruton photographed this one at Pennington Park BUR on August 31, 2019.
The spreadsheet below compares the abundances of all species recorded in 2019 and in 2020 to their average abundances over our log’s first full ten-years, 2009-2018.
SJBF Project 2019 and 2020 Butterflies Vs. 10-Year Averages
Explanation:
We have two sets of numbers available each year to quantify abundance: the numbers of reports logged for the species; and the numbers of individuals that observers have estimated for the species in each of those reports. Imagine a hypothetical year when our log’s complete record for Edwards’ hairstreak looked like this:
- Two Edwards’ hairstreaks reported from Peaslee WMA in late June.
- One Edwards’ reported from near the Atlantic City airport in early July.
- Four Edwards’ reported from the Hesstown powerline later in July.
Our year-end numbers for the species would be: 3 reports; 7 individuals
Ten-year averages for both total reports and total individuals were calculated for all species that were found in at least seven of the years between 2009 and 2018.
Green-highlighted numbers = Species whose 2019 and/or 2020 numbers were greater than 150% of their ten-year averages.
Yellow-highlighted numbers = Species whose 2019 and/or 2020 numbers were less than 50% of their ten-averages.
Blue-highlighted numbers = problematic totals. The clearest example of these members of the spring azure complex whose numbers have recently shifted relative to each other because many observers have begun to question our abilities to separate them to species. The low numbers of two members of that complex (blueberry azure and holly azure) almost certainly reflect this development more than their actual population levels.
— Jack Connor (March 2021)

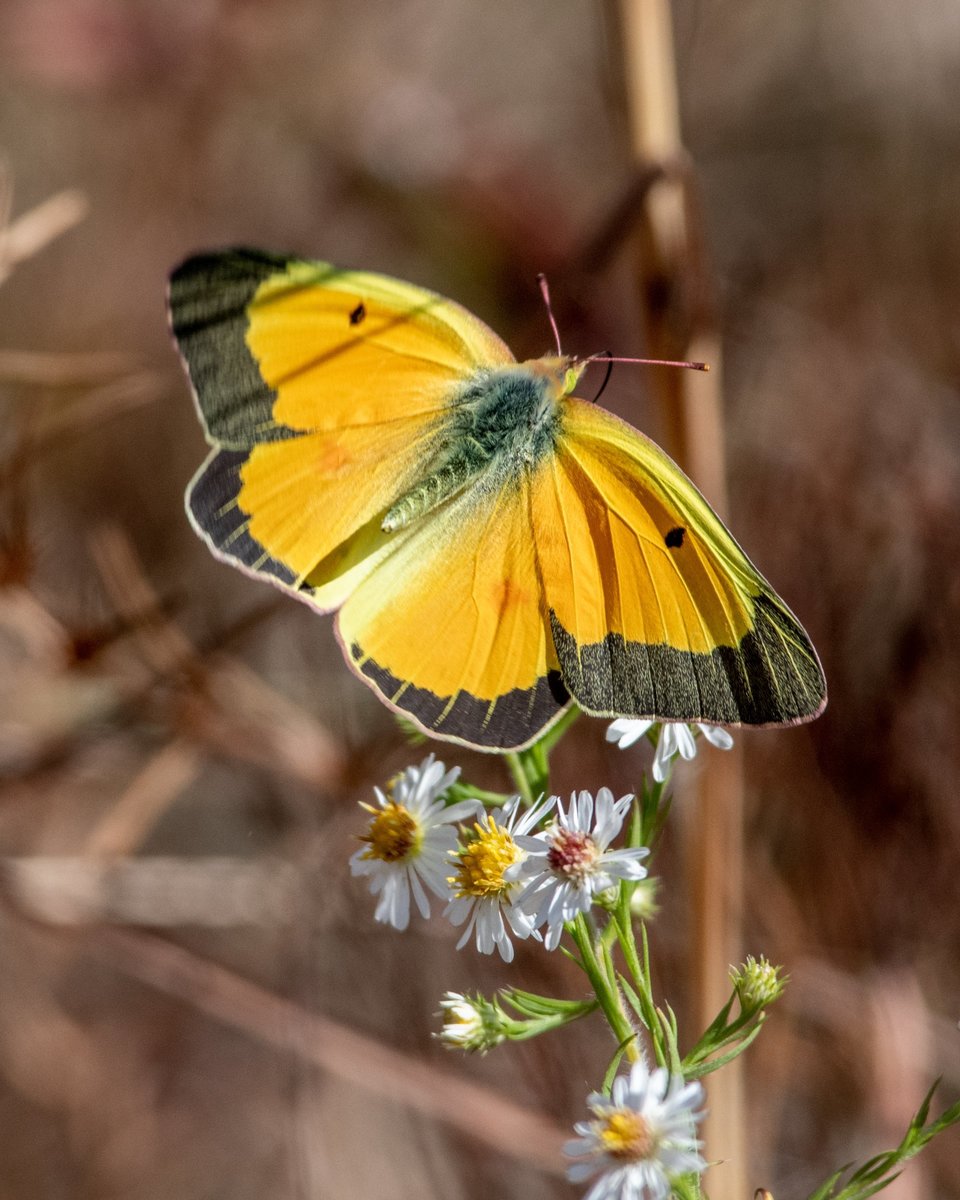
An orange sulphur photographed by Harold Davis at Cape May Point State Park on October 15, 2019. Orange sulphurs outnumbered snouts in both 2019 and 2020 (as they always do), but in comparison to their own 10-year-averages, they had much worse years than the snouts did — generating less than half the numbers of reports they averaged from 2009-18 and fewer than a fifth their average number of individuals.
