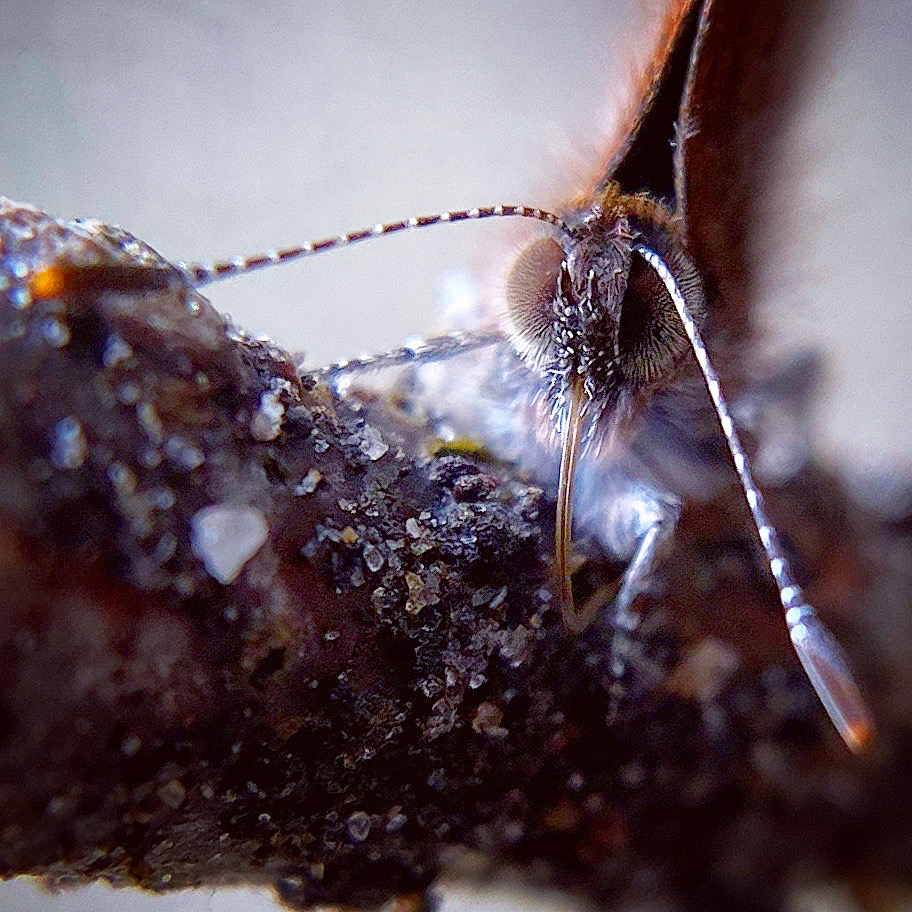
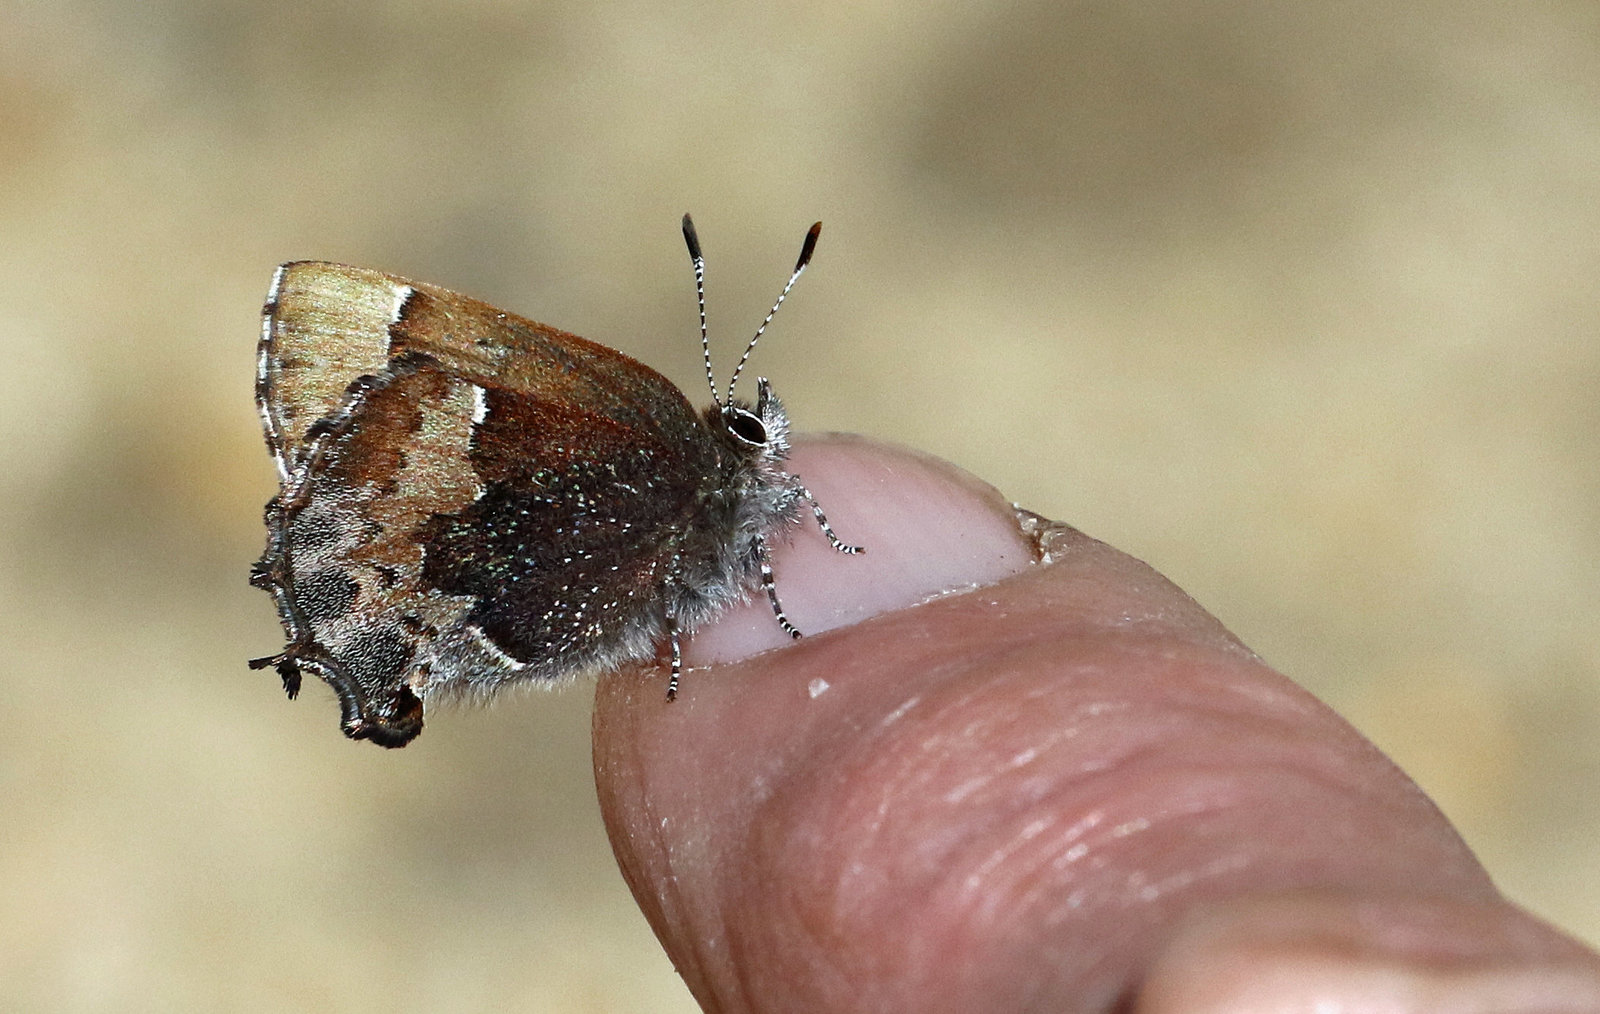
An amazing IPhone close-up of a Henry’s elfin taken by Keara Giannotti, one of our new contributors, at Camp Creek Run, BUR, on March 31.
We recorded 19 species in March, 2020, the best count for the third month of the year since March 2016, when we also found 19. We also broke three earliest First-Of-Year records for the log and tied two others.
Our March 2020 list:
- black swallowtail [3/17/20 FOY ties 3/17/12 for our earliest ever]
- cabbage white
- falcate orange-tip [3/20 one day earlier than previous earliest, 3/21/12]
- clouded sulphur
- orange sulpur
- American copper [3/27 one day earlier than previous earliest, 3/28/12]
- Henry’s elfin [3/14 ties 3/14/12 for our earliest ever]
- eastern pine elfin
- gray hairstreak
- blueberry azure
- holly azure
- eastern-tailed blue
- American snout
- question mark
- eastern comma
- mourning cloak
- red admiral
- monarch [3/9 more than month earlier than previous earliest 4/11/08]
- Juvenal’s duskywing
We totaled 89 reports, our third best total for March since our log began in 2008, and we had reports from 29 observers, including four new contributors: Jason Bojcyzk, Lynn Day, Keara Giannotti, and Nancy Larrabee. Welcome to each of you!
The monarch flying northbound over Delaware Bay spotted by Tom Reed on March 9 seems the most extraordinary find of the month. Even today as I write this — April 6th, 27 days later — the closest monarch reports on Journey North are two from the southeastern corner of Virginia: one from Virginia Beach on 3/29/20 and the other from Newport News on 4/2/20. Here is Tom’s report:
Monarch 3-9-20, Cape May Point
A photo from the month worth studying is this intriguing shot from Karen and Brian Johnson taken at Belleplain State Forest on March 14. How many species can you find?
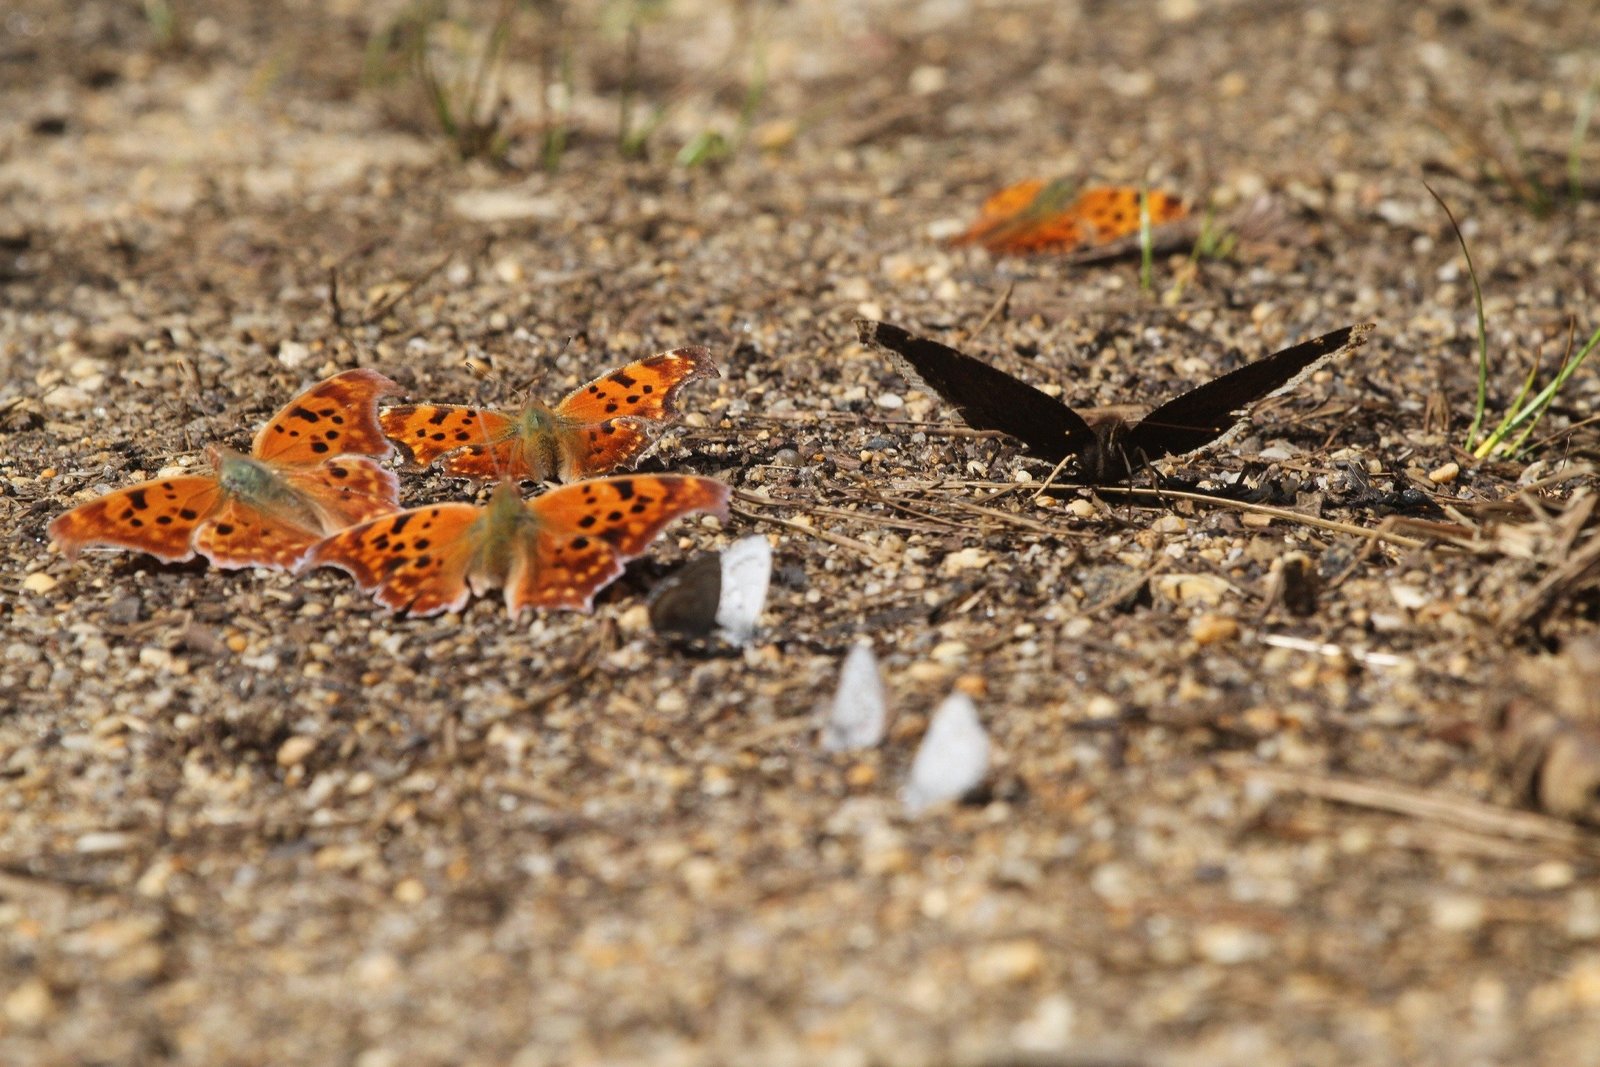
Answer: Guests At The Puddle Party
Another photo worth a careful study is this one by Steve Glynn:
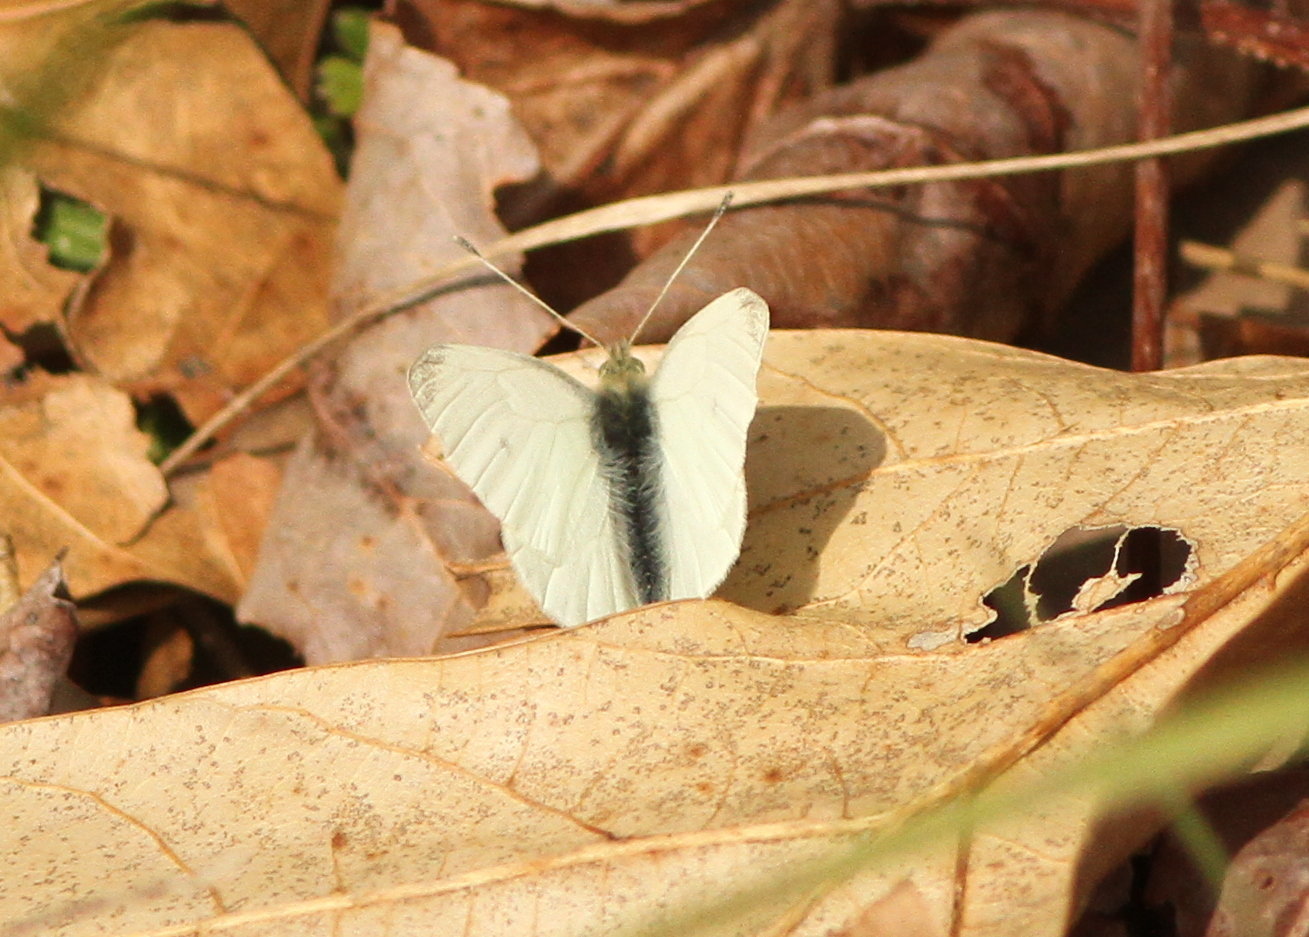
Has anyone else seen or photographed this form of cabbage white? Cech & Tudor note in their Butterflies Of The East Coast, “Some spring males are almost pure white and must be distinguished with care from mustard white.” This comment seems to suggest that such individuals are not rare, but I can’t find any similar photos on our log. If you have one, please send along.
Do March Butterfly Numbers Jump In Leap Years?
The three best March counts of our log’s thirteen years have all come in leap years: Both 2020 and 2016 gave us 19 species; 2012, by far our best March ever, yielded 32! Our log began in March of the previous leap year, 2008, with half a dozen observers, too few to confirm or deny any patterns.
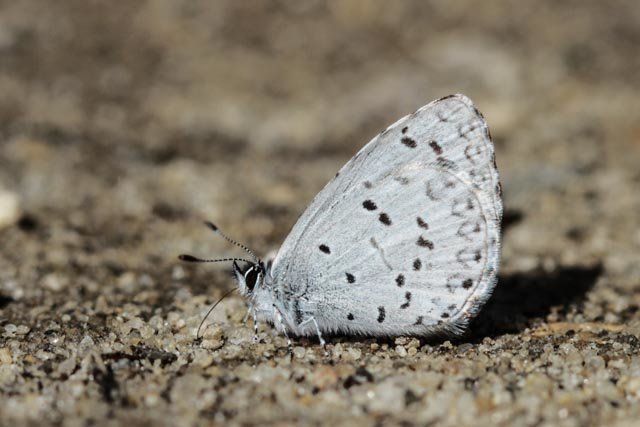
To appreciate the numbers of the three recent leap years you have to contrast them with more ordinary March counts, e.g. last year with 10 species; 2018 with 8; and 2017 with a respectable count of 14. In 2015, our worst March, we totaled only three species: mourning cloak, eastern comma, and a spring azure — which squeaked in with a single report of a single individual on the last day of the month.
We gain a day in leap years, of course. March 1 is the 60th day of the year instead of the 59th, but that small difference can’t be the explanation.
More often than not, March’s in-like-a-lion winds, wildly-fluctuating temperatures, occasional sleet and sometimes snow make trouble for butterflies of early spring. Those days also discourage potential observers who know they will have more fun chasing ducks, gannets, and other seabirds out on the coast or staying home with a hot cup of cocoa.
However, every few years — by chance recently every four years — March gives our butterflies and our observers a break.
And could it be that it is just as important that the preceding winter months are warmer than usual? That has been the situation for each of our recent leap year winters.
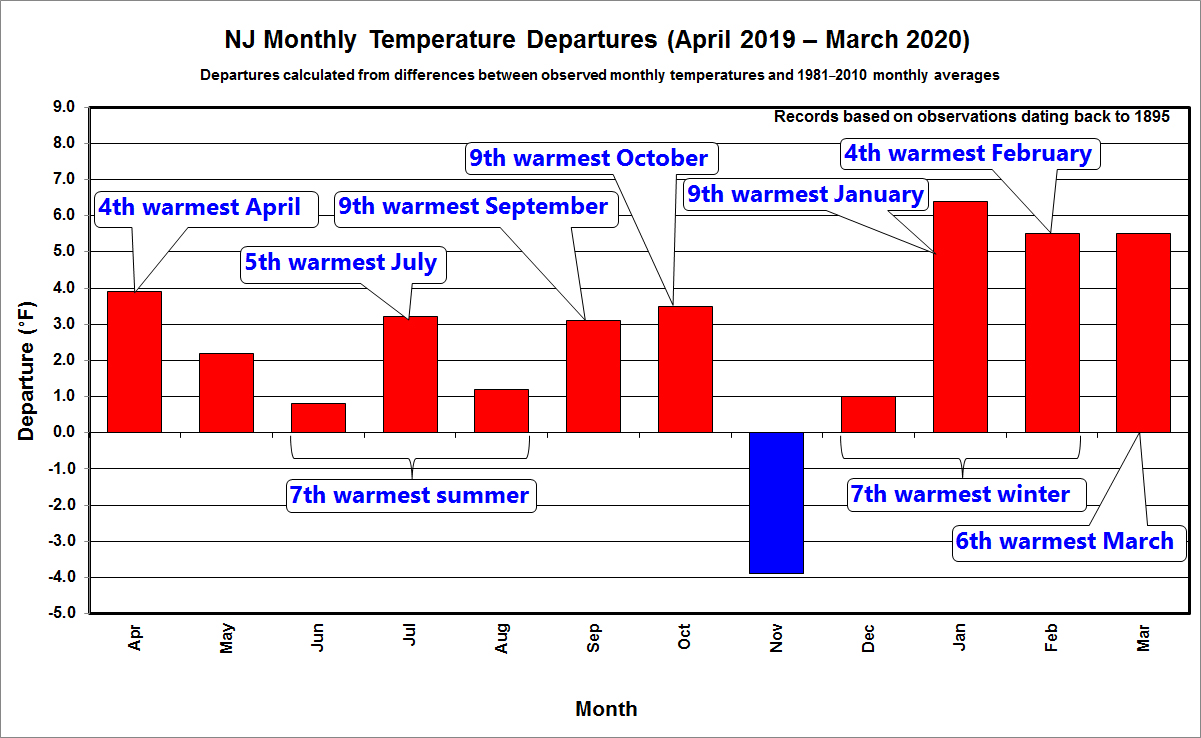
It does not seem much of a reach to speculate that March 2020’s good butterfly life could have been triggered by the very mild months of December, January, and February that preceded it. (See “A Snoutstanding Winter” below.) Certainly, our numbers for four over-wintering species — snout, question mark, comma, and mourning cloak — seem to reflect that. Individuals of these species almost certainly survived in higher numbers because we had so few days of sleet, snow, and sub-freezing temperatures December to February. This case is clearest with mourning cloak. The species had one of the worst breeding seasons of any South Jersey butterfly in 2019 — with total reports down to a third of its ten-year average and barely a fifth its ten-year average in individual numbers. (See “A Teaser Challenge” post below.) Yet, we had 31 reports of mourning cloaks this past month — many of multiple individuals — which is more than the March report totals for 2019 (10), 2018 (7), and 2017 (8) combined. In fact, our 31 mourning cloak reports in March 2020 nearly matched our total of 38 reports for all months of 2019, January to December.
The weather of the 2015-16 “cold” months also looks like it might have something to do with our previous good butterfly March — in 2016. Remember December 2015 — when violets bloomed and blueberry azures emerged before Christmas? November 2015 was also extraordinarily warm. In fact, November 2015 and December 2015 were — and remain — the warmest November and December ever recorded in southern NJ. March 2016 was also well above average — one of the five warmest March months ever recorded in southern NJ.
Finally, there is March 2012, possibly the most extraordinary single month of any in our log’s history. We found 32 species that month, more than double the March average, and established 23 earliest-ever records, most of which still stand now, eight years later. You can review it here:
That explosion too seems set up by the warm four months that preceded it. November 2011 and December 2011 are among the five warmest Novembers and Decembers ever recorded, January and February 2012 were each more than five degrees above average, and March 2012 itself was and remains the warmest March ever documented in southern NJ since record-keeping began in 1895. It was also dry — a rare March with less than two inches of precipitation. We found butterflies on 29 of its 31 days. How often has that happened in any month of the year, much less March?
If you want to review these historical monthly records from the New Jersey Climatologist’s Office yourself (it can be very educational to dive into this rabbit hole!), go here:
New Jersey Historic Monthly Climate Tables
Thanks to all contributors this month:
Cynthia Allen, Pat & Dave Amadio, Dolores Amesbury, Tom Bailey, Tom Baxter, Jason Bojcyzk, Jennifer Bulava, Claire Campbell, Jesse & Jack Connor, Lynn Day, Keara Giannotti, Steven Glynn, Chris Herz, Karen & Brian Johnson, Sandra Keller, Meredith Koenig, Chip Krilowicz, Nancy Larrabee, Mike Lee, Jack Miller, Beth Polvino, Tom Reed, Pat & Clay Sutton, Harvey Tomlinson, and C. Wylunda.
Keep exploring and reporting, everyone. And stay safe!
Jack Connor 4/6/20
Update May 6, 2020:
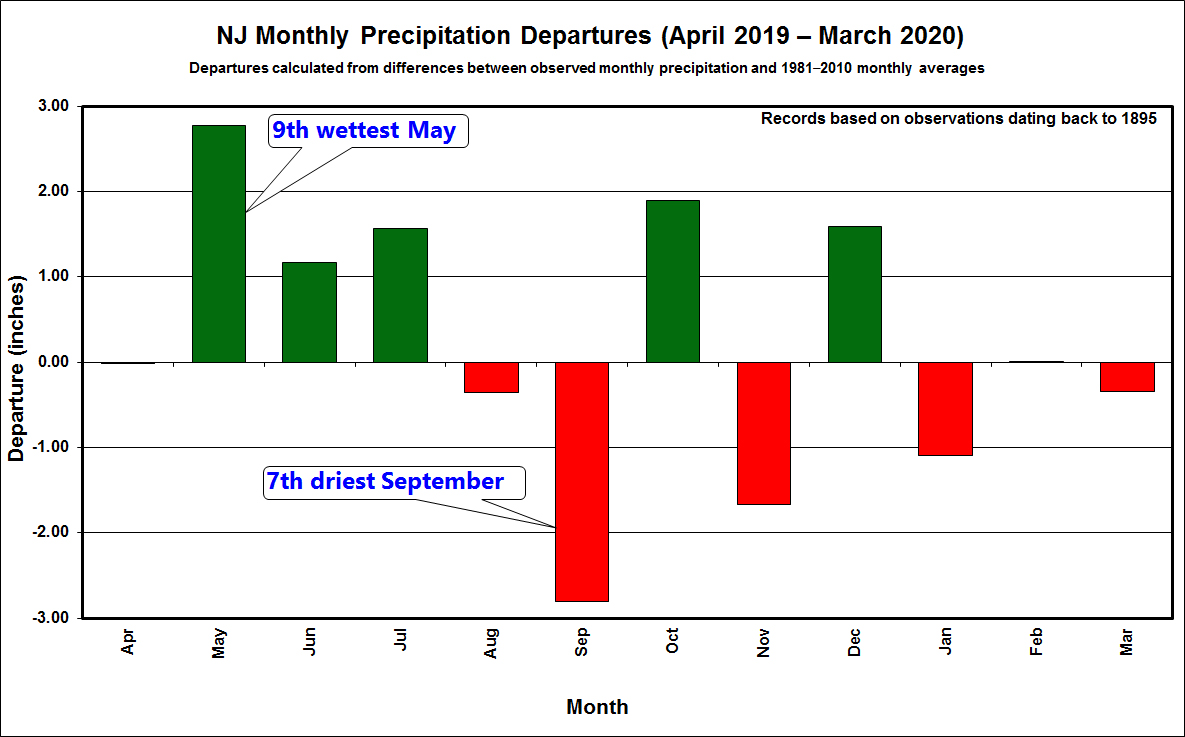
The New Jersey Climatologist’s Office has posted the bar graphs for temperature and precipitation now including March, 2020. Statewide, the month was much warmer than March’s average (South Jersey’s average temperature was 47.6, more than 5 degrees above our March average for the last 30 years). We had slightly less rain than average for the month. (South Jersey recorded 3.86 inches vs our 30-year-March average of 4.19 inches.) Both factors almost certainly contributed to the good number of species and individuals we recorded.
