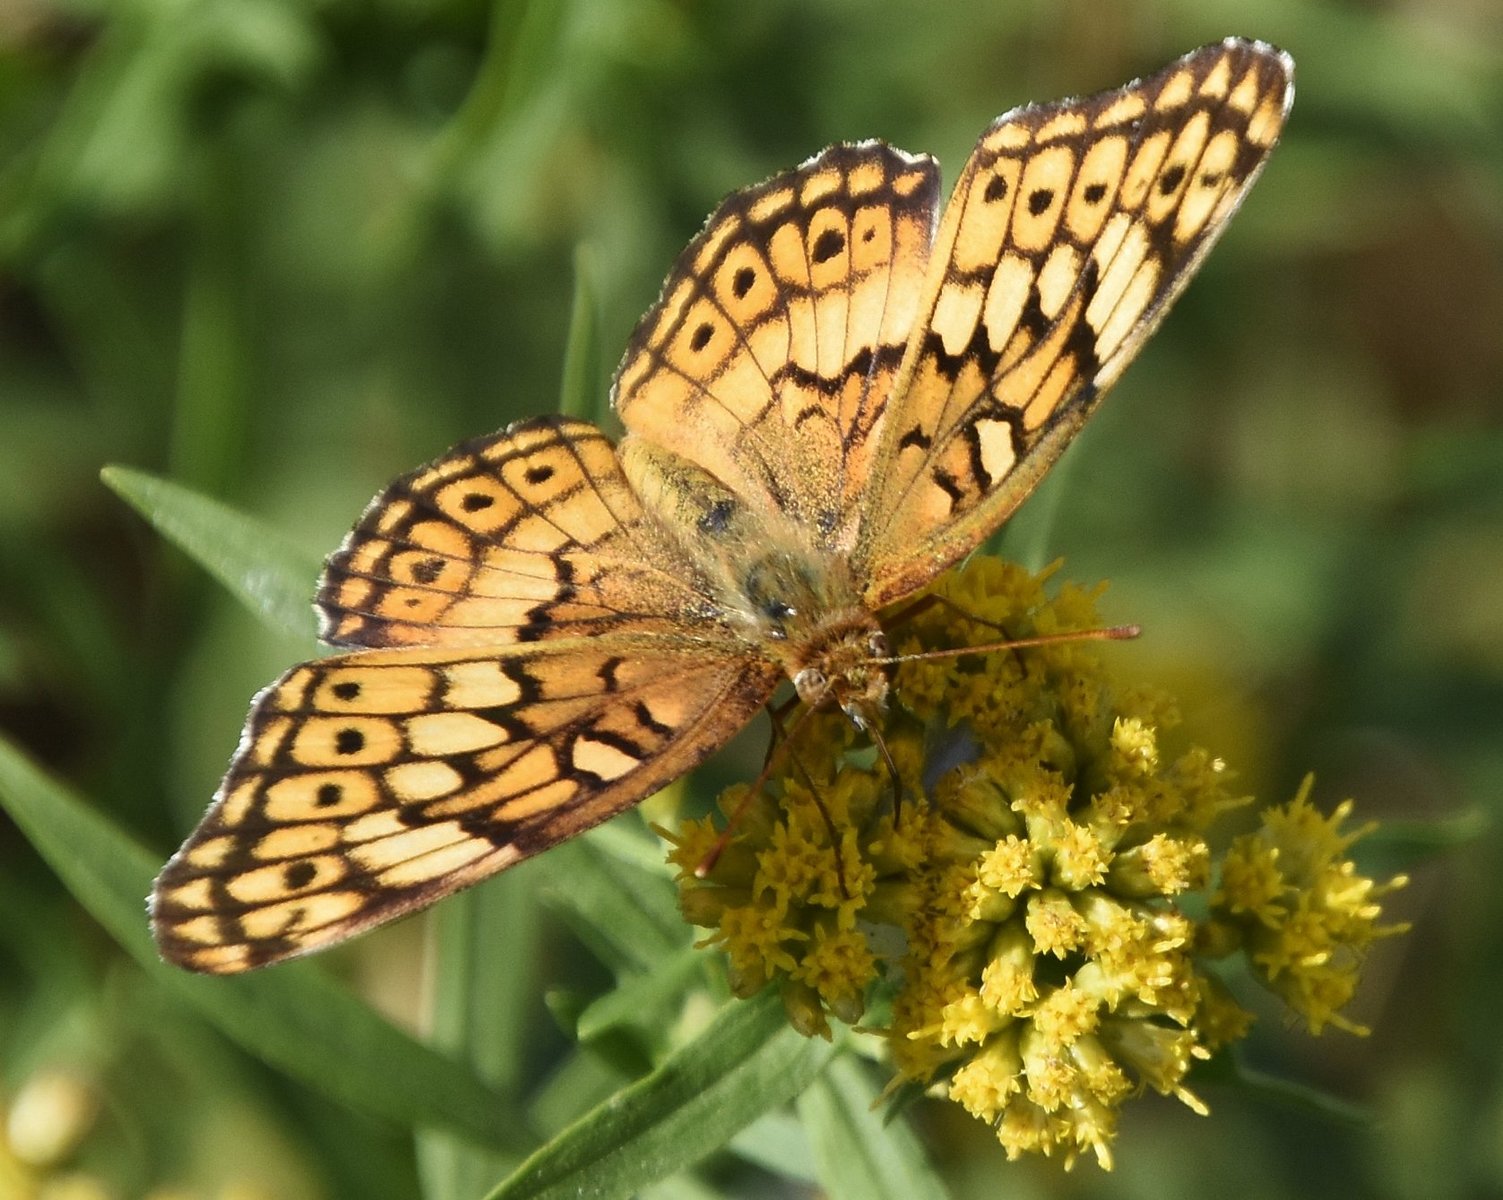
Robert Koch photo’d this variegated fritillary on September 18 in Lumberton Leas, BUR. Was 2019 a good year for the species or a bad one?
Thanks to good work by David Reese, who has tweaked his already wonderful reporting system, we are now able to post our Early & Late Dates Spreadsheet more quickly and accurately. You can find the 2019 update at either the link on our banner above (with info about how to read it) or by clicking below for direct access to the spreadsheet by itself:
Early & Late Dates, Updated for 2019
Even better than making the annual dates update easier, David has also made it possible for us to compile two different measures of butterfly abundances through an automated process — the totals of reports we collect for each species each year and the numbers of individuals estimated by all observers totaled for all reports for each species.
With some spread-sheet work on our own, we can also compile and calculate multi-year averages for all species for both measurements of abundance. I am still working out those numbers, but having already found some surprises, I thought some of you might like to test your own “gut feeling” sense of those numbers against the data, before the full report is uploaded here in another week or so.
The 2019 Teaser Challenge:
Here are six common species in South Jersey (arranged in taxonomic sequence) that had very different levels of success in 2019:
- Orange Sulphur
- American Snout
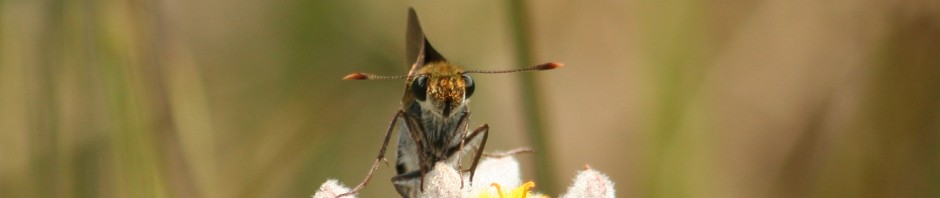
- Variegated Fritillary
- Mourning Cloak
- Red-spotted Purple
- Common Wood-nymph
Three of them had very good years; the other three had bad ones. Can you guess which fit into those two “winner or loser?” categories for 2019?
This is not a question about their overall abundances compared with one another. It involves a better measure of annual success (and makes a more challenging question):
How did each species do in 2019 vs. its own ten-year-averages for 2009-2018?
Our “Oscar” Winner For 2019:
The biggest winner of the six — the species with the best year of any of our common South Jersey butterflies (vs. its usual performance) — doubled its ten-year average by both our quantifiable measures — in reports and in total individuals counted. If you were out and about chasing butterflies in 2019 (and you are familiar with normal distributions and numbers of our common species), this might be the easiest of the six species to name. Can you pull 2019’s biggest winner out of the line-up?
Winners Two & Three:
The other two winners from the list of six couldn’t match Species #1’s success, but they did very well in 2019 nonetheless. One generated 144% of its yearly average of reports and 136% its average annual individuals total. The third generated 129% its average number of reports and 171% its average number of individuals counted. Depending on how carefully you follow the log, identifying them may be a tougher challenge than naming Species #1.
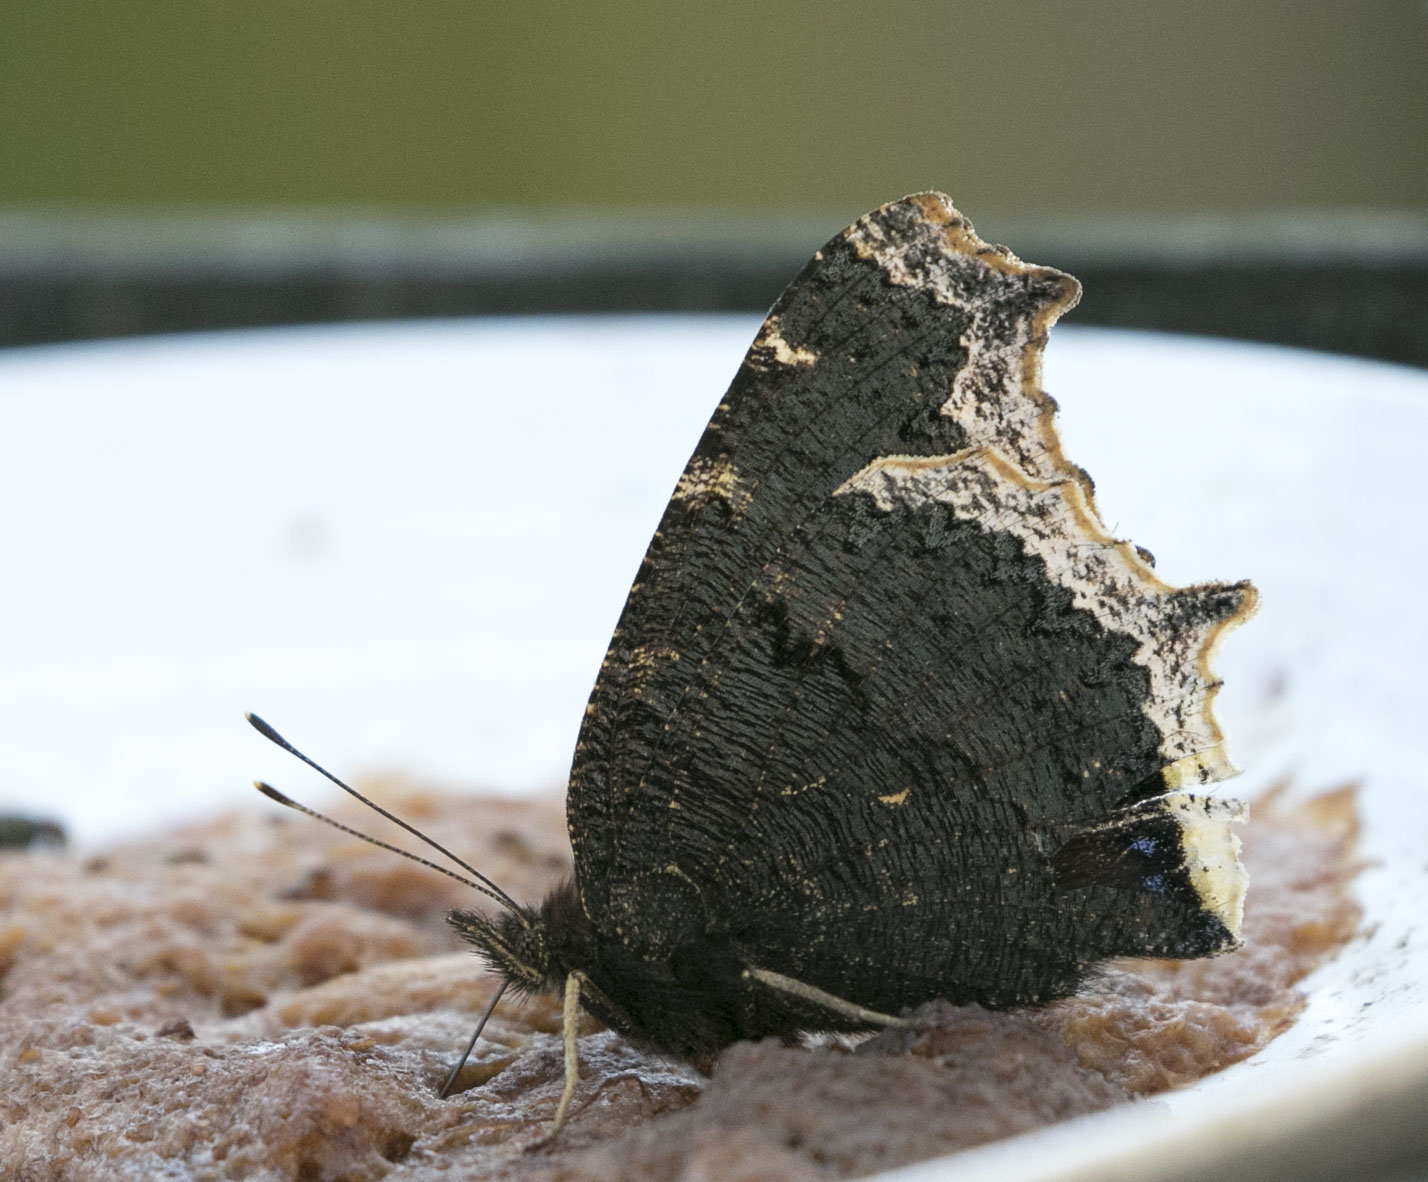
Mourning Cloak, photo’d by Beth Polvino in her garden in CMY 9-29-19. Was 2019 a good year or a bad one for this species in South Jersey?
Three Losers in 2019:
One overall hint about the “down” group is that all three species in this category also did poorly in 2018 — and so now have had two bad years in a row.
For two of them 2018 and 2019 were their two worst years in the years of our log. One of these ended 2019 with a report total only one-third of its ten-year average and individuals total less than a quarter — 23% — its average total (in other words, down 77%). The other species showed a report total down 60% from its ten-year average and generated a total individual count the lowest ever for the species on our log, only 17% of its average (i.e. down 83%).
The third loser did slightly better (vs. its own ten-year averages) than the two species above but still was down significantly: down 55% in reports and down 65% in total individuals.
Can you think back over your own butterfly explorations last year and your memories of browsing on the log and then divide the group of six into three that had “up” years in 2019 and the three that were “down”? My sense is this will prove a tough challenge. Kudos to anyone who sorts all six correctly!
The list again:
- Orange Sulphur
- American Snout
- Variegated Fritillary
- Mourning Cloak
- Red-spotted Purple
- Common Wood-nymph
— Jack Connor