American snout has seldom been discovered over-wintering in New Jersey. In 2016, however, we had five reports in February and March from three different sites in Cape May County. Jim Dowdell documented the first with this photo taken on Bucks Avenue in Goshen on Feb 29.
Thanks again to Jack Miller for his many hours of work compiling all our reports for both 2015 and 2016, his species-by-species analysis, and for his notes about his difficulties assembling his 2016 Compilation.
He points to a genuine problem, one that seems worth recognizing as we begin the new 10th year of the South Jersey Butterfly Project. Our use of Common, Abundant, and Superabundant and the complexities created by observers reporting from the same spots on multiple days mean that our totals of individuals contain both under-counts and over-counts.
The murkiness of individual numbers goes back to our first year, 2008, with the original Google docs spreadsheet — i.e. it is not a consequence of our adoption of the David Reese system in September 2015.
Because observers have always gone wherever they choose (in the southern eight counties), re-visited sites as often as they like, and estimated numbers following their own personal methodologies, our counts of individual numbers often do not add up accurately.
Does anyone have an answer to that problem? Or do we have to live with it?
My personal sense is that we have to live with it, but I’d be very interested in hearing from anyone with a work-around — as long as it does not discourage observers and so lead to fewer reports.
The NABA July 4th Butterfly Counts – modeled on the Christmas Bird Counts – follow a restricted methodology that does lead to censuses. Teams organize for a single, 8- or 9-hour effort on one day of the year, and stay within demarcated sub-territories of the larger count circle. Each team stops at scattered spots inside their sub-territories; each of these spots is surveyed once; each team agrees on the numbers seen in the spots they have chosen to visit and in the sub-territory overall; the compiler collects, totals and reports the numbers from all teams and sub-territories; and the survey is complete. “Common,” “Abundant,’ and “Super-Abundant” are not permitted. Teams are told not to count in other teams’ areas, and the observers do not repeat the count until the next year. (Any observers returning to the same spots the next day or the next week to try to add to the totals found on the original count day would be ignored, if not laughed at.)
There are well-known problems with that NABA July 4th methodology: species that fly only in spring and fall are missed; excessive heat, high winds and other weather extremes that happen to occur on that once-a-year-date can be significant factors; the limited number of volunteers for most counts means many areas within each circle are left un-visited; and perhaps most importantly, the very few and widely-scattered areas where NABA counters are able to organize their efforts and draw their circles leave most of any state’s landscape entirely un-surveyed.
Still, because July 4th teams follow standard protocols, and the counts are repeated in the same areas year after year, the NABA counts come closer to being accurate censuses of individuals than our sightings log does.
In its current design, our log is more like a collection of “snap-shots” of butterfly numbers than an overall census. It’s a less formal survey.
If three observers go to Cape May Point’s Triangle Garden on the same day and one reports one long-tailed skipper to our log, another reports three long-tails, and a third reports four, a log reader should not conclude that a total of eight long-tailed skippers have visited the garden that day. A more accurate understanding is, “Long-tailed skipper can currently be found fairly easily at Cape May Point. You may even find four individuals in the Triangle Garden in a single stop there.”
Similarly, when I post three times in a week from our yard listing twenty sachems for one day, ten for another, and thirty for a third day, a log reader should not conclude that sixty different sachems have appeared here. The best you might conclude is something like, “Sachems are present in double-digit numbers, ranging between ten and thirty per day, in one small spot in Atlantic County this week.”
I think we can defend our system, however. Our Sightings Log may not be an accurate census of butterfly numbers, but we cover a many-times-larger area than covered by the NABA Counts of South Jersey (or any other butterfly census in South Jersey) and we are active all twelve months of the year — and collect data on hundreds of days each year.
Our informal methods and year-round persistence – and our growing numbers of participant observers – have enabled us to document much about the butterfly life of South Jersey that you would be hard pressed to find in the results on any carefully-controlled censuses.
Admittedly, there are some tricks to interpreting our log’s information. You must read between the lines a little. Most of us, for example, probably pay more attention to the number of reports of a species by different observers — especially if they come from different sites — than to the simple sum of individuals of that species reported by all observers from all sites. In other words, three reports of a total of eight long-tailed skippers from three different observers in three different sites in South Jersey on the same day tell you more than three reports for the same total on the same date from the Triangle Garden. Three reports of double-digit sachems from three widely-scattered butterfly gardens are more meaningful than an apparent total of sixty sachems from one garden over three days.
There are other tricks as well, Once you get a feel for our log, however, you can find answers to questions such as:
- Which species fly most commonly not just in July but in each month of the year, including the seldom-studied months of November, December, January, February, and March?
- What are the relative abundance of species within various groups in South Jersey? Which is the most common elfin? Which is the rarest of the five? Which is the most common of our five Satyrium? Which is the rarest? Which has been the more common Polygonia this year? Was the other one the more common species last year?
- How do the South Jersey ranges of closely-related species differ? For example, how does the South Jersey range of viceroy contrast with its fellow Limenitis, the red-spotted purple? Or, how do the ranges of the three Polites — Peck’s, tawny-edged, and crossline skippers — compare? Or, the ranges of our old four and now five Poanes skippers: mulberrry wing, zabulon, Aaron’s, broad-winged, and our newly added Hobomok?
- How does seasonality differ among close relatives? What’s the story, for example, with our three most numerous Celastrina species — blueberry azure, holly azure, and summer azure? How can time of year be used to help separate those three close look-alikes? How about Juvenal’s and Horace’s duskywings? How can time of year help separate those two? And how reliable is that difference?
- When are the very best two-week windows of the year to search for Pine Barrens specialties such as sleepy duskywing, hoary elfin, bog copper, dotted skipper, and two-spotted skipper?
- What about those hard-to-pin-down “North Jersey species” such as pipevine swallowtail, harvester, and great spangled fritillary? When and where can I search for them on the Coastal Plain?
- Which species have two and three broods in South Jersey and when should each brood be expected? When, for example, does the second brood of white-m hairstreak usually appear, or the second and third broods of bronze copper?
- How have the numbers of southern wanderers – cloudless sulphur, little yellow, long-tailed skipper, Ocola skipper, et al — changed over the past decade?
- Which species seem to be most troubled on NJ’s Coastal Plain? Have any species apparently disappeared from the southern half of the state in the last decade?
- Which species seem to be increasing here?
Additions, counter-points, and other comments are welcome. Especially if you have a solution to the over-count/under-count problem, please let us hear from you.
Jack Connor
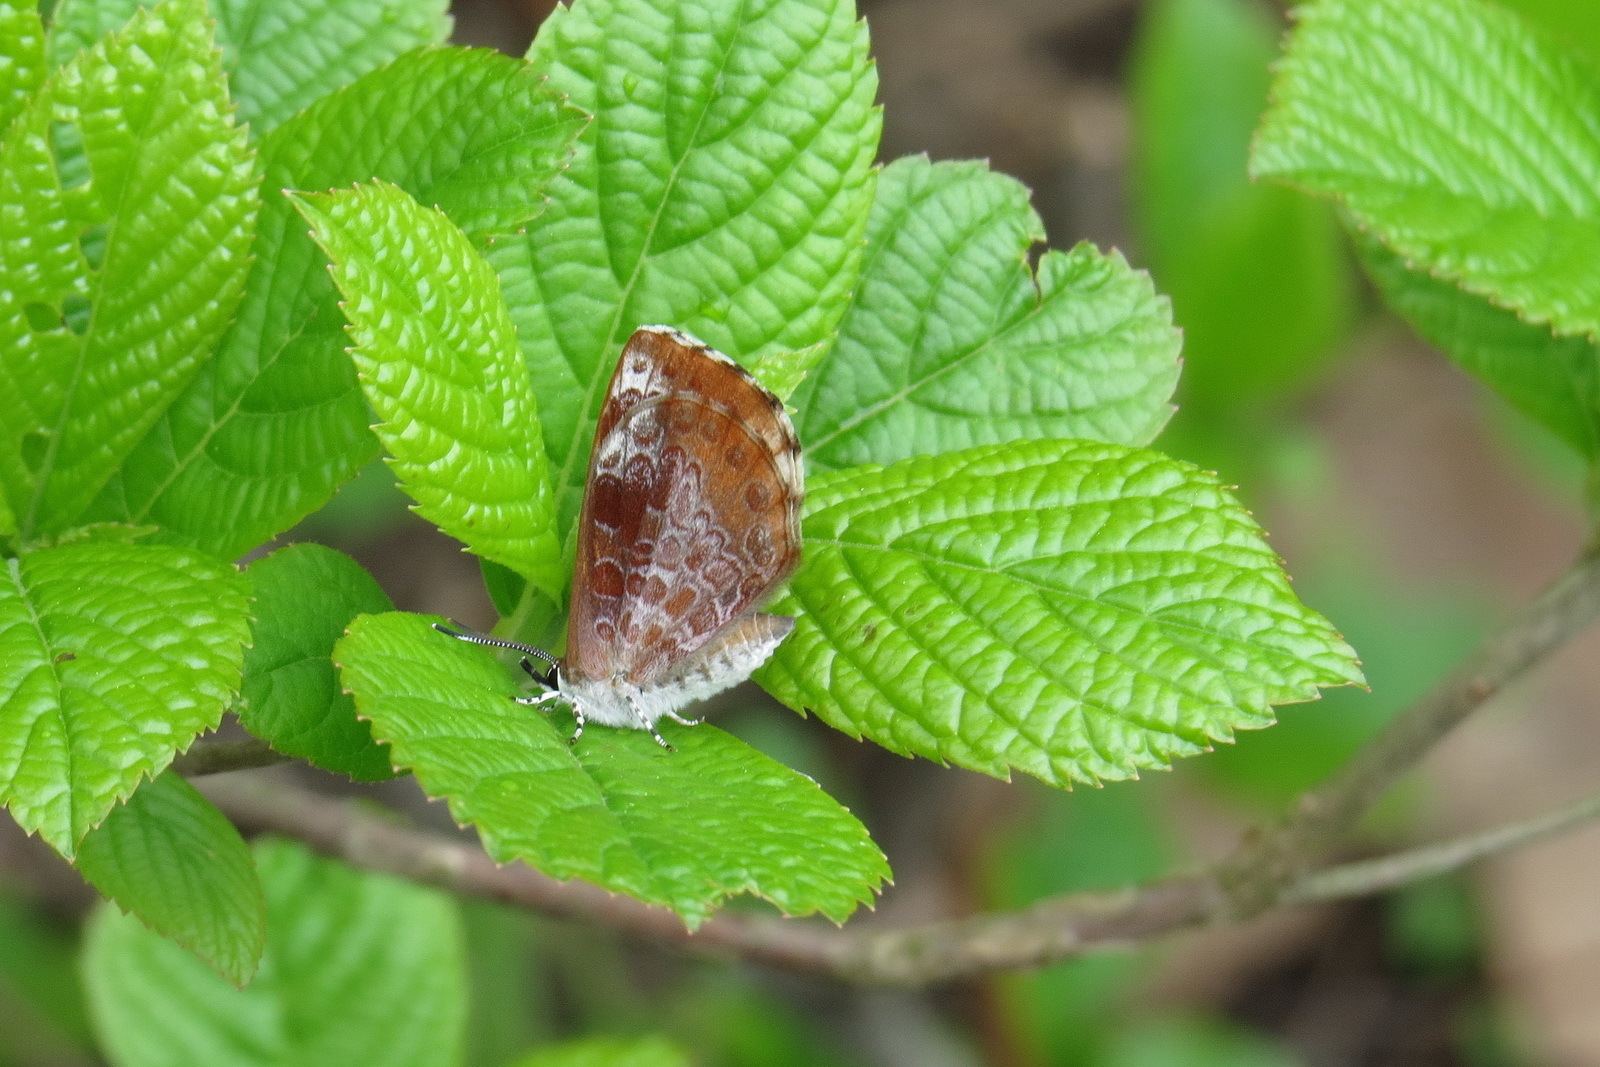
Our first harvester for 2016, photo’d by Jennifer Bulava on 5-10-16, a record early date, at a new site for the species in South Jersey: Boundary Creek, Moorestown, BUR.
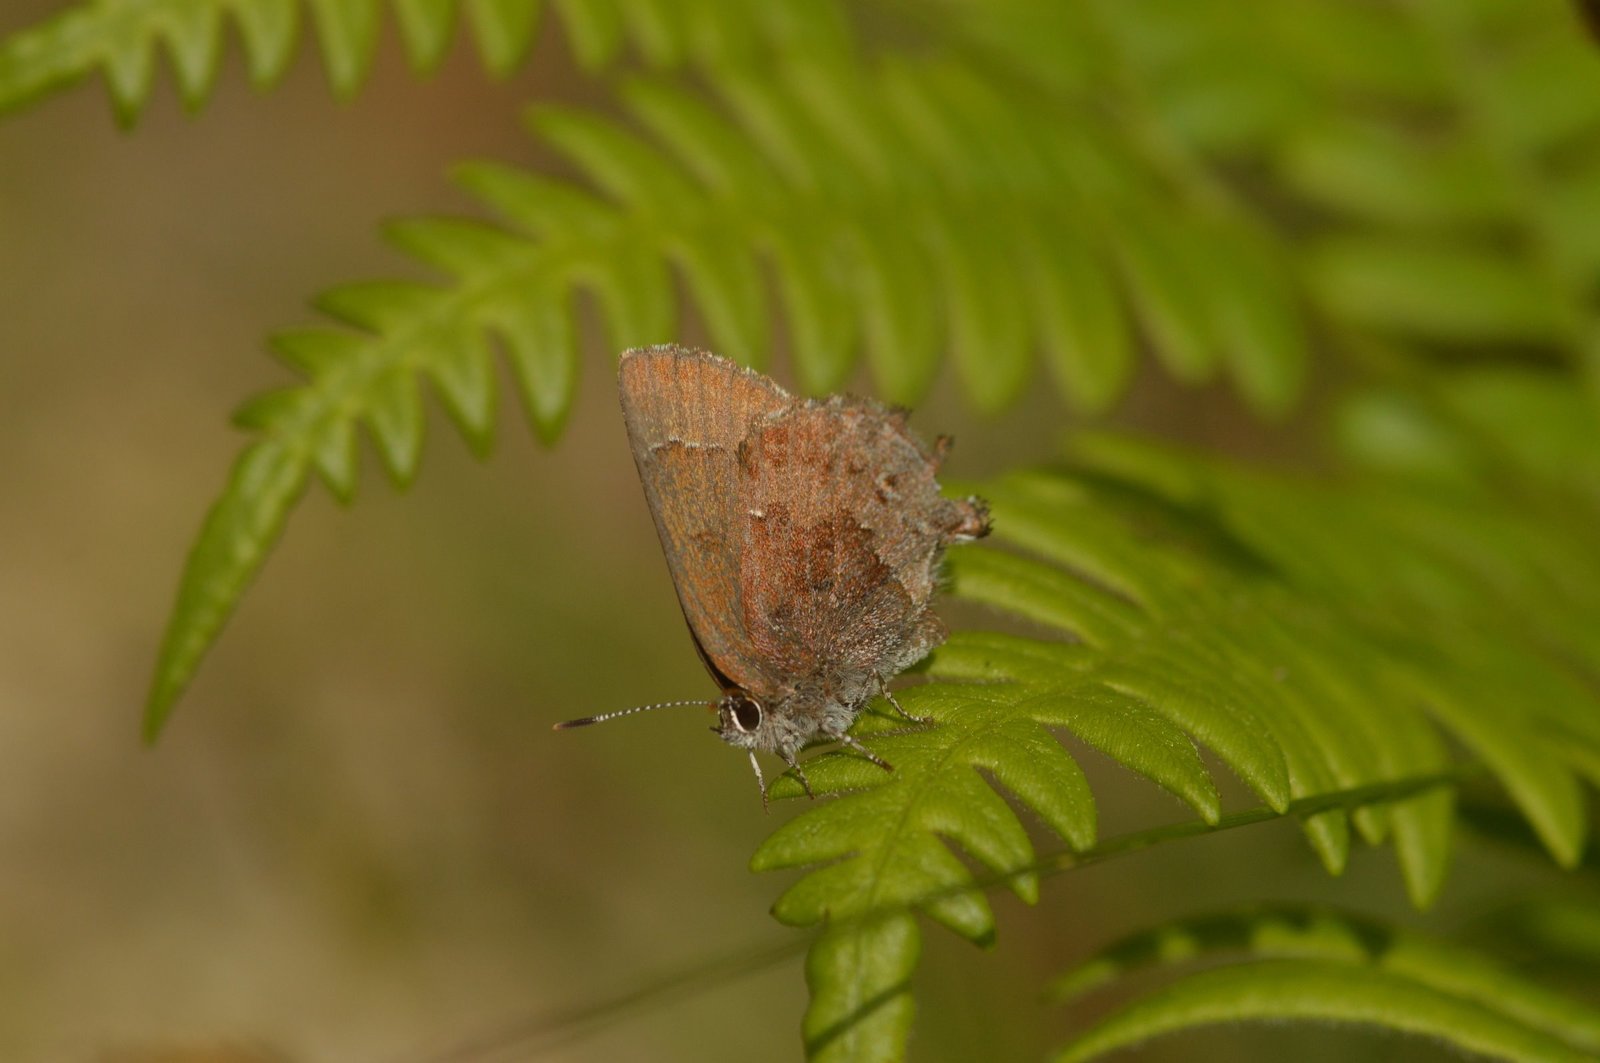
Generally, pine elfin and frosted elfins are the latest-flying elfins in South Jersey. In 2016 Will Kerling documented our last, a frosted (and the last of all single-brooded spring species this year) at Lizard Tail Swamp Preserve, CMY, on June 4.
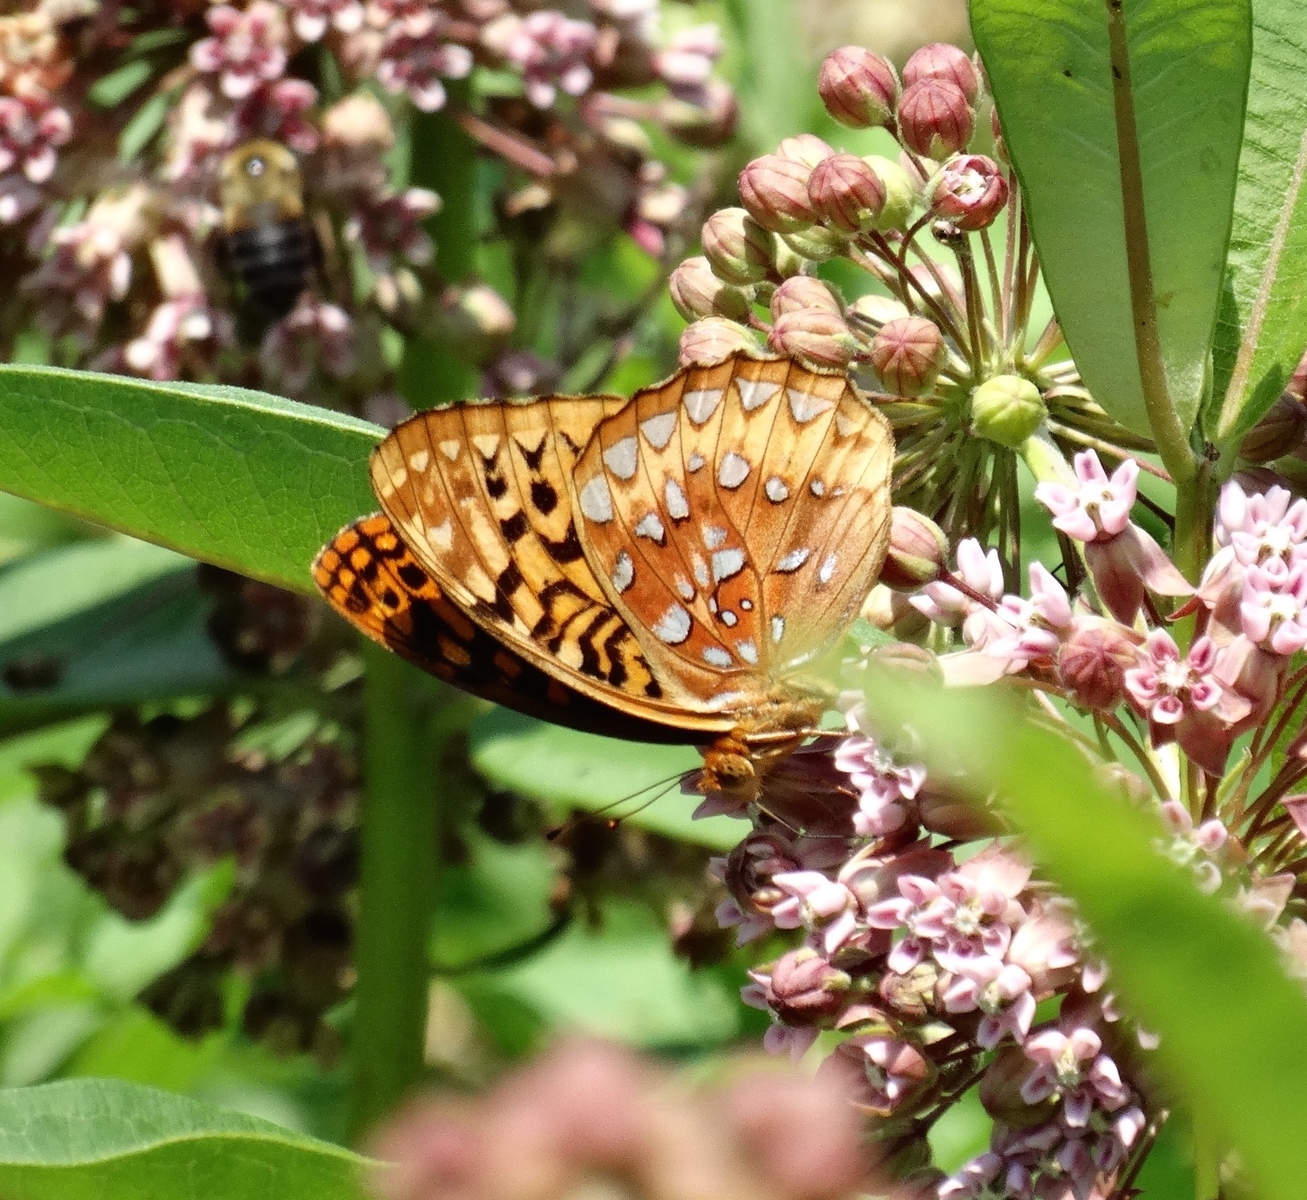
Salem County has proven to be our best South Jersey county for great spangled fritillary over the years. This one was reported by Sandra Keller in Marilyn Patterson’s garden on 6-25-16.
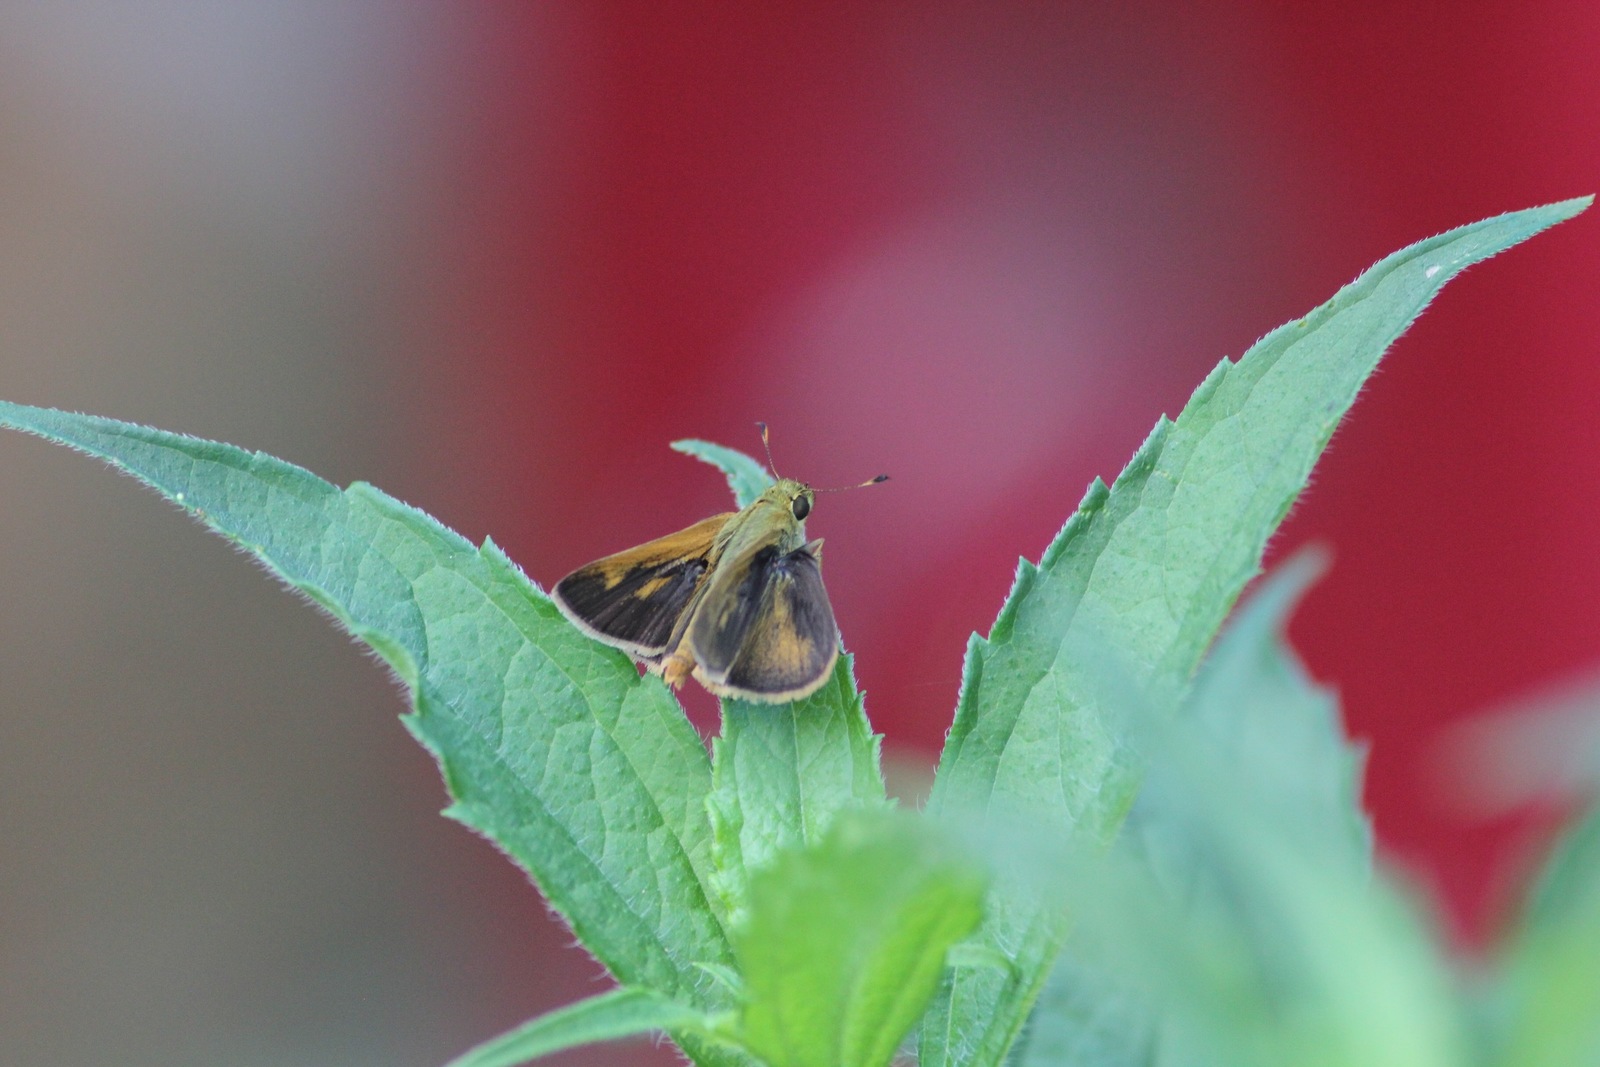
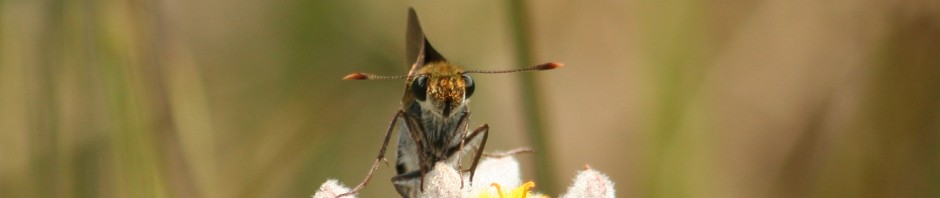
A broken dash, sp? Dolores Amesbury photo’d this skipper in her garden in CMCH on 7-21-16. Is it the expected norther b-d? Or do you detect some puzzling reddish tones?
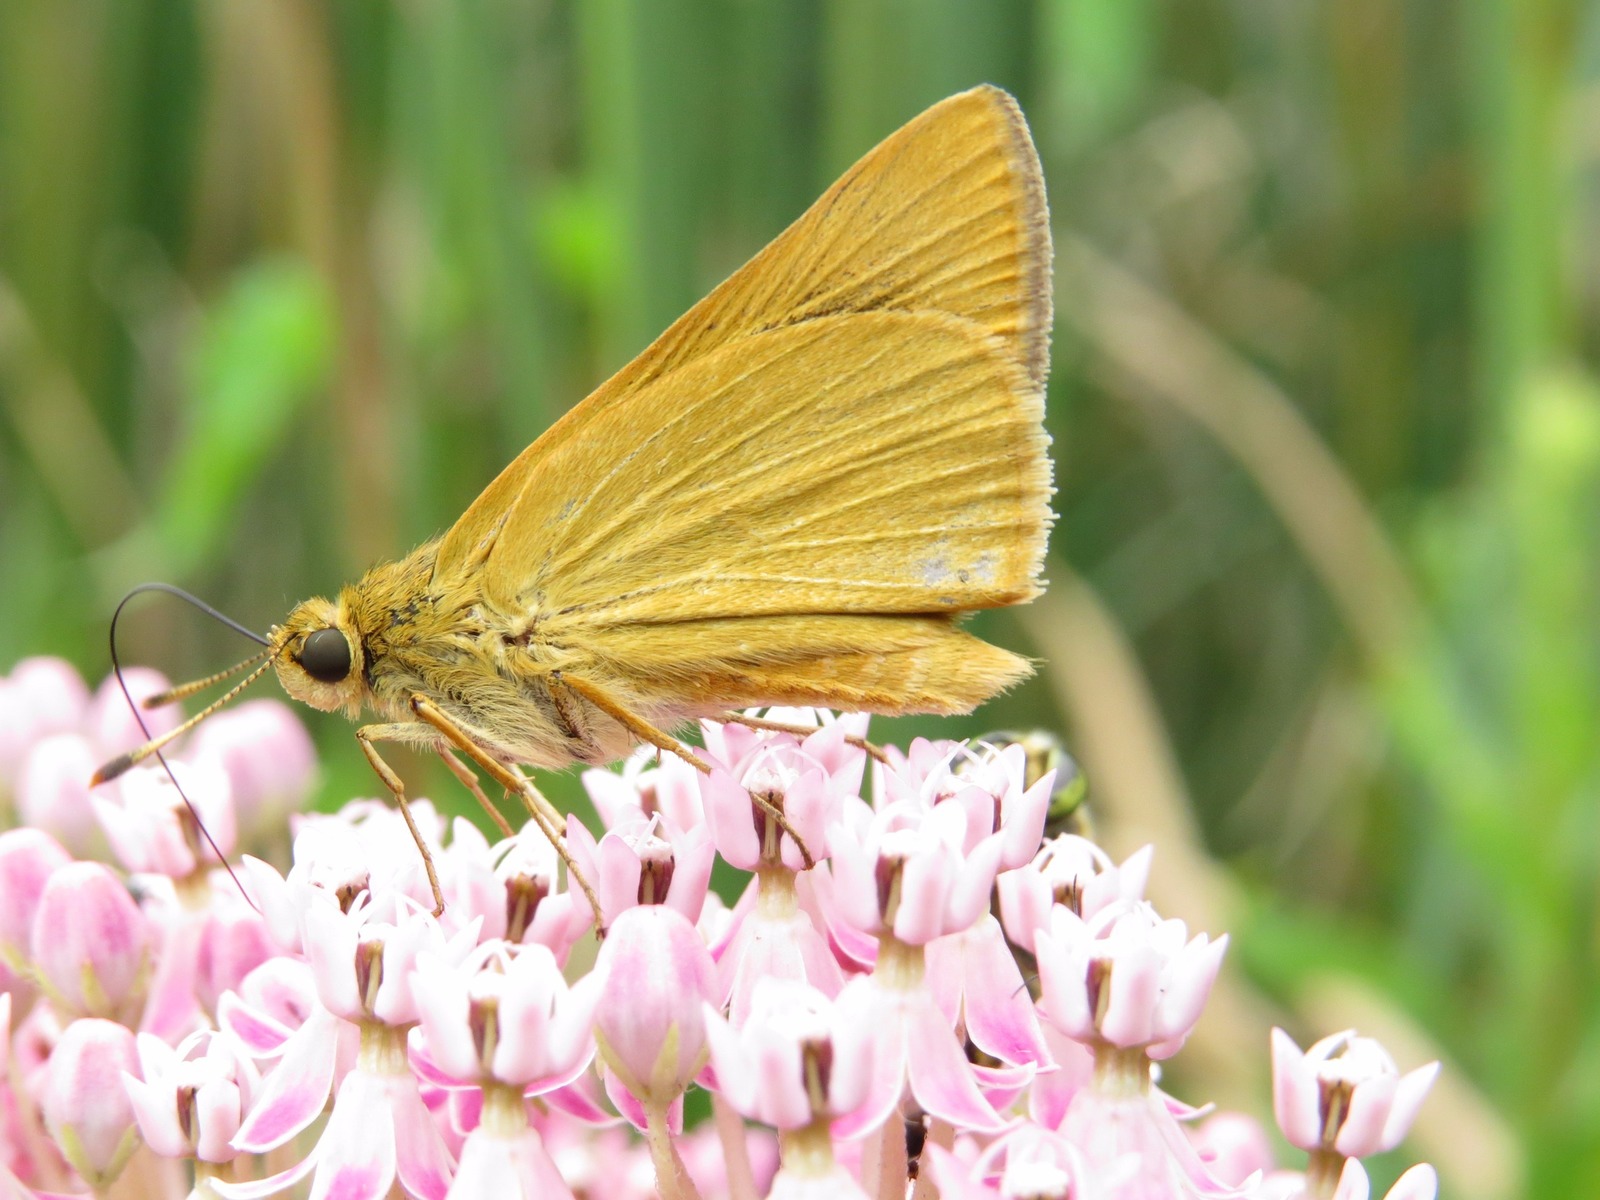
As usual, the rare skipper flight was mostly a July phenomenon in 2016. In fact, this year our reports of the species spanned exactly one month — from July 1 to August 1, when Tom Bailey found our last one in Elsinboro, SAL.
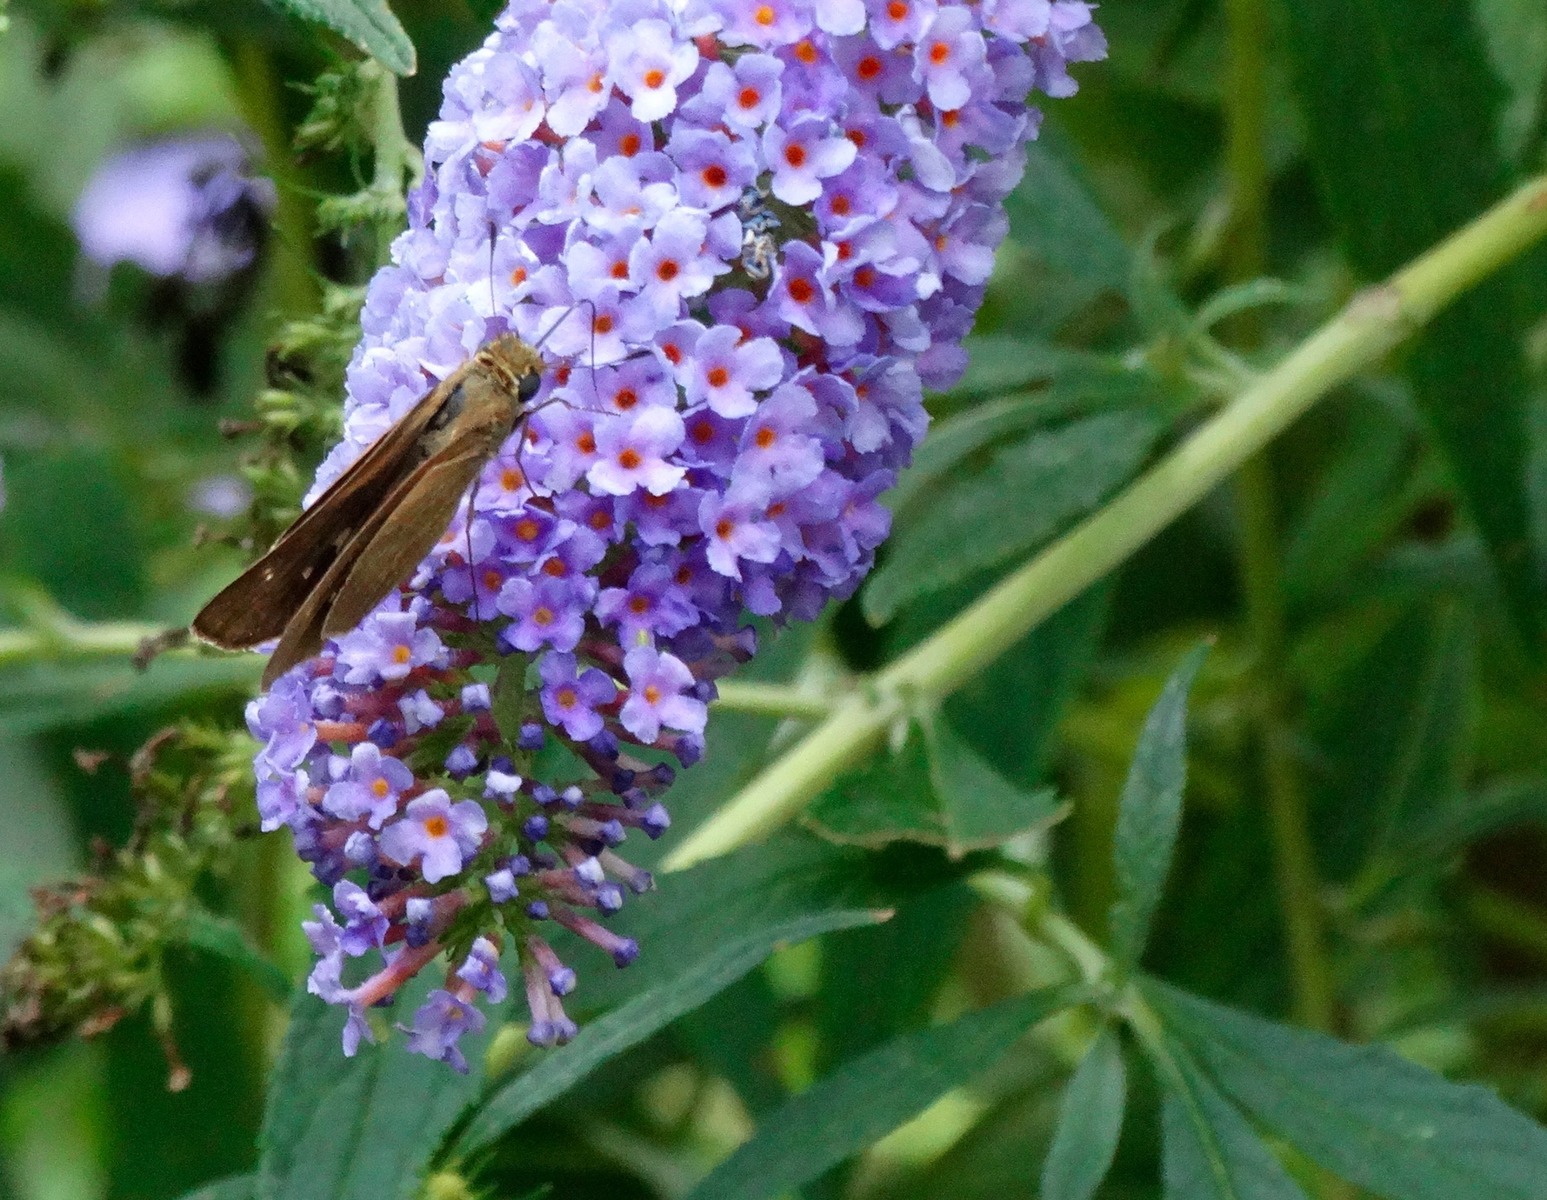
Ocola skipper seems to have become a more reliable “wrong-way” southern migrant over the years of our log, and 2016 was a particularly good year for the species here. Chris Herz documented this one in her garden in Audubon, CAM, on September 6.
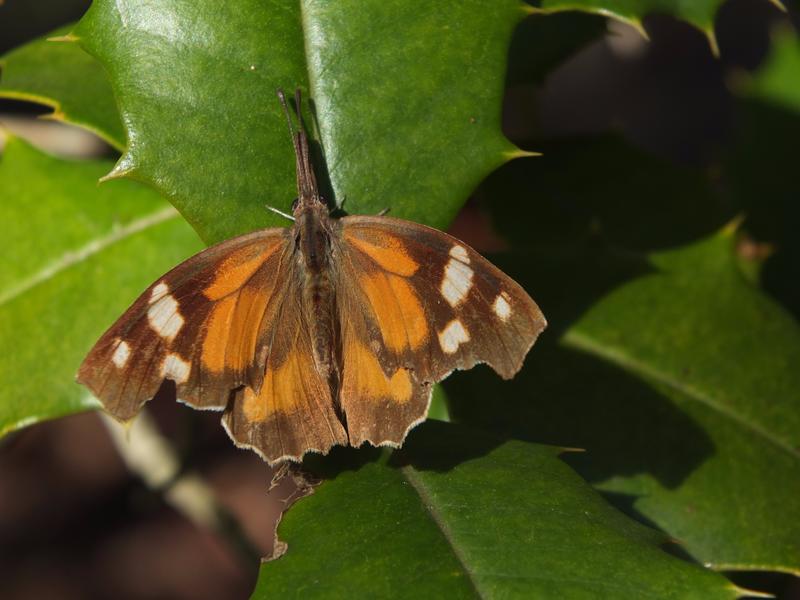
This red-spotted purple, photo’d by Dave Amadio in Mantua, GLO, on 9-25-16 shows faint white marks — a pattern we have documented on a handful of rsp’s over the years. We have yet to record a white admiral in South Jersey, however, so it seems these marks more likely reflect genetic variation in rsp’s than hybrid ancestry.

Over the years of our project (2008-2016) checkered white has proven to be far more numerous in our western counties than in our eastern. This female checkered white Beth Polvino found in her garden on Oct 29 in Cape May County was only the second we have recorded in that county. (And we have yet to find the species in Atlantic or Ocean Counties.)
The issue of accuracy of counts is a tough one for sure. I’ve been an early adopter of using the “common” and “abundant” vernacular on our SJ Sightings Log, having found it appropriately usable from the national NABA sightings portal.
When I’m in the field and capable of doing a more thorough count, I carry with me dial counters that I employ when I run into big counts on either general or select species and feel it worthy to get as accurate a count upon as I can. Not everyone may see this workable for them, but I’d toss out a soft recommendation that buying some counters to carry would be useful to everyone. The counters can be found pretty cheaply, as I bought some online for less than a quarter apiece. Perhaps the only caution we should hold in our minds when using the “common”, et al reporting method is to make an actual attempt at a hard count at some points in the season. If we all abandoned the attempts at “real” counts and fell prey to just noting something as “common”, then we would be lessening the worthiness of our reporting. The truer science of the NABA Regional Counts is another method we all have enjoyed contributing to, but when circumstances prevent these counts, the importance of our blog’s reporting provides a data set for those seeking it.
I guess the other issue is whether or not our collective “counts” are to be taken as serious data for a higher purpose (research, historical tracking, etc.) and should have a more strict adherence to a protocol. To this end, the general nature of the inputted data may not serve this higher purpose. Given the multiple entries possible on a given day, at a given location, thus presuming redoubling of individuals counted, our data entry system isn’t a pure enough data set. But I don’t think this was intended to be a pure scientific research system, but more of a system to provides historical data and “perspective” gathering as the years roll on through the changes in seasons, as well as growing or shrinking interest and participation levels by our users. And I don’t think this is anything to be less than proud of.
I guess it all means that we’re doing worthwhile efforts, noting the grace and beauty of our butterflies, along with generalized, but useful numbers data. If someone wanted to use the data for a more serious extrapolation, then perhaps doing averaging of the totals would be more useful.
That’s my take, for what it’s worth.