Home » Posts tagged '#Infographics' (Page 5)
Tag Archives: #Infographics
Benchmark Comparisons
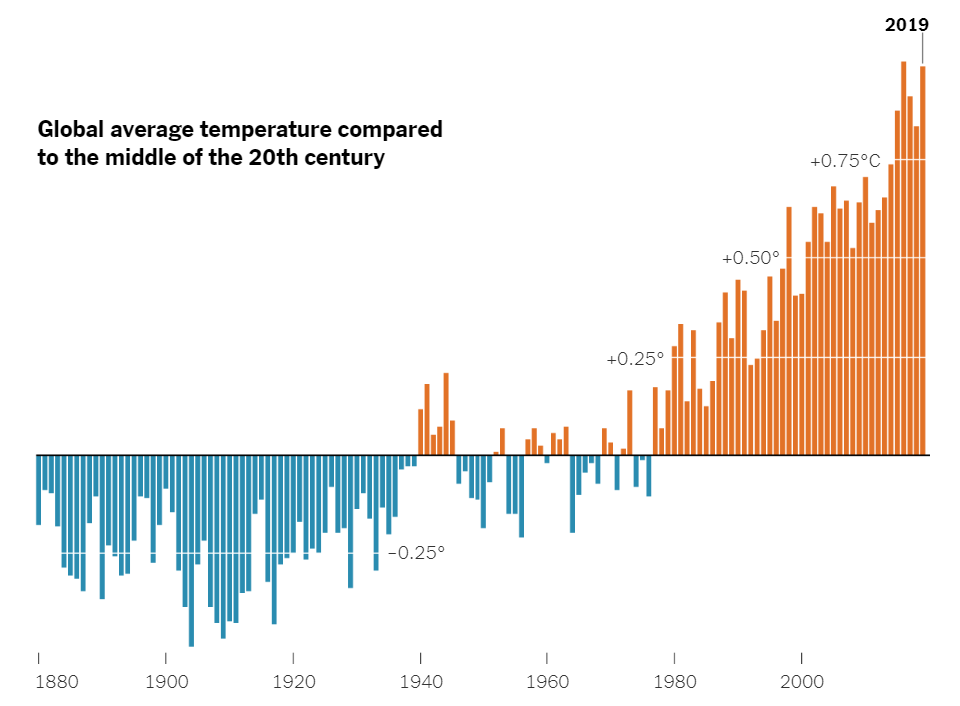
Here is a chart that uses a benchmark to show the varying global average temperatures. The benchmark is used along the x axis at 0 degrees Celsius. The blue lines represent the average temperature for that year, and it falls below the average global temperature of the middle 20th century. The orange lines represent the years with the average global temperature being above the average global temperature from the middle 20th century. As you can see, there is a general increase in global average temperature over the years. A benchmark is very effective here because it splits up the data into two groups. The years that fall below average, and the years that are above average. The trend of rising global temperatures is easily seen here, making this a very effective infographic.
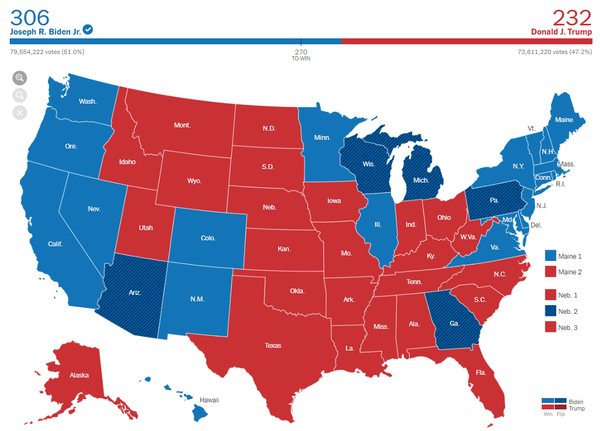
Here is another infographic that uses a benchmark in a different way. This is the 2020 presidential election map. The benchmark is shown above the map. It says “270 to win”. This means that 270 electoral college votes are needed in order to win the race. 270 is the benchmark. Joe Biden exceeded this benchmark, and Donald Trump failed to reach the benchmark. Therefore, Joe Biden won the election because he passed the benchmark. On the graph, you can see that Joe Biden passed the benchmark through color coding. Joe Biden is blue, and the blue line passes the benchmark of 270. This is a very effective infographic that uses a benchmark in a unique way. As shown by these two examples, there are many different ways to use benchmarks, and there are many different forms of benchmarks.