Home » Big Numbers
Category Archives: Big Numbers
Visualizing Health
This week’s chapter in Effective Data Visualization is all about the importance of a single number. Chapter 2 explains that sometimes all we really need is for people to remember one important number because the number itself is impactful.
Risk Calculator
The Risk Calculator on VizHealth.org is a great example of the importance of a single number. It was very easy to input your information, and the calculated results display an effective visualization on your risk of developing cardiovascular disease within the next 10 years. When the results popped up, I immediately looked at the percentage for my risk. The number was big and bold, immediately attracting my attention. I believe this was the creator’s intent, so I would say they were successful in making an effective visualization.

Icon Array Generator
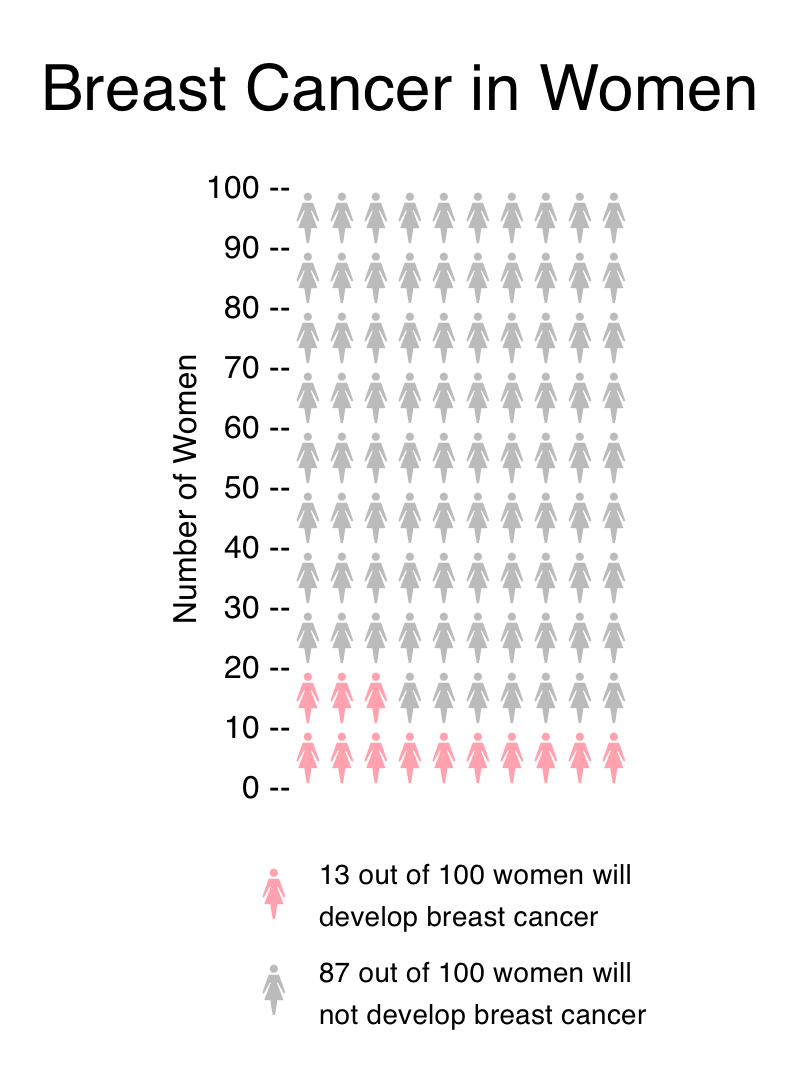
Another useful tool in creating an effective visualization is the Icon Array Generator on VizHealth.org. I was able to quickly input data and easily navigate through the various editing options. This is a great way to display a percentage because it clearly maps out the amount of people out of 100 that are at risk for a certain condition. You can adjust the quantity, gender, and color of each outcome value as well as adjust the labels for the Y-axis, legends, and title.

If I could change one thing about this generator, it would be to have the ability to edit the “default outcome value.” This website is meant to effectively communicate health data and risks, and I believe some data would be more effective out of different numbers such as 10, 20, etc. For example, in my Visualize a Big Number assignment this week I displayed the same data on breast cancer risks in women. Instead of showing 13 out of 100 women (as seen above), I wrote “1 out of 8.” In my opinion, 1 out of 8 seems like a lot more than 13 out of 100. Women may be more apt to get screened if the ratio is more impactful. I believe this minor change would positively help communicate health data.
Benchmark Comparisons
Some different ways people can show comparisons to a benchmark is through competitive, strategic, & performance. Competitive benchmarking is emphasized as the most effective form of benchmarking for businesses, allowing them to assess their true success by comparing themselves to competitors. It provides insights into industry trends and competitor strategies. To perform competitive benchmarking effectively, companies should establish clear goals and parameters and leverage digital tools for in-depth analysis, going beyond basic benchmarks like revenue and growth to gain a granular view of competitors’ data for more informed decision-making. Strategic benchmarking focuses on learning from industry leaders and best-in-class companies to understand their success and identify areas for improvement in your own business. It involves analyzing their business models and strategies to optimize various aspects of your own organization, such as marketing, online presence, or finances. Mobile app intelligence tools like Similarweb are highlighted as essential for gaining insights into mobile app trends and competitors’ strategies. Performance benchmarking aims to compare profitability and establish ambitious but achievable goals based on quantitative data comparisons, focusing on performance indicators like price, quality, speed, and reliability, ultimately driving continuous improvement.

is this graph of the “U.S. Debt Rises Irrespective of Who Is in the White House” the benchmark is the debt. In this graph the numbers highlighted in blue at the bottom represent Democrats in office and red represents Republican. In this graph it shows typically it doesnt matter which group is in office because the debt rises no matter what.

In this graph it shows Germanys power consumption throughout the years. The benchmark line is the yellow line indicating renewable shares. Germany is predicting that it will raise from 50% to 80% in the next 10 years.
sources
https://www.statista.com/chart/1505/americas-debt-ceiling-dilemma/