Pivot Table for Garlic
For my example of uses for pivot tables I decided to make a pivot table for some research I’ve been doing for the past 3 years at Stockton looking at yield data for garlic harvests.
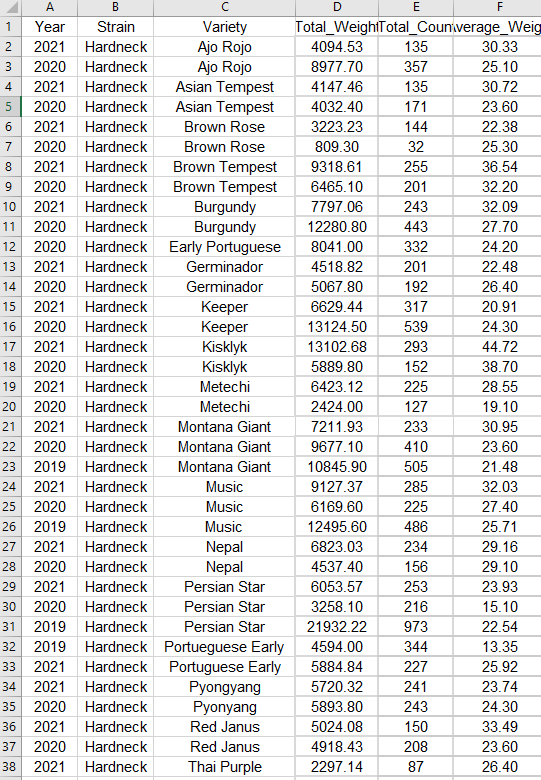
The above screenshot is just a segment of the stacked data in its raw format. It floods you with numbers and is difficult to sort through and get any information out of. That’s where a pivot table comes in. These let you easily select data to look at with the click of a button, and they also have a huge amount of customization to get the exact information you need.
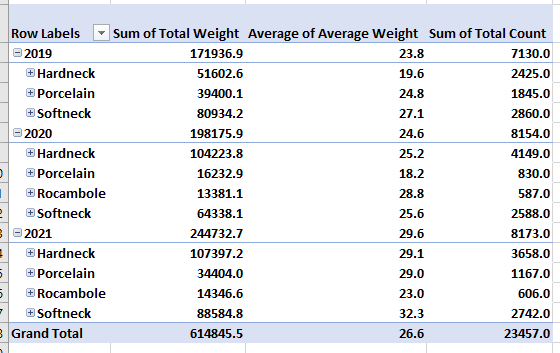
This first example shows how well each type of garlic grew during each year of the study. We can see from this that the top grower varied from year to year. Hardnecks were often grown in the highest volumes, making their total weight the highest, but either Rocambole or Softnecks had the highest average weight during each year. This means that if these varieties were grown in higher volumes they may outcompete the hardnecks.
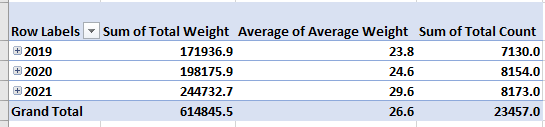
Another factor we can look at is time. This pivot table selection shows us that overall, we grew larger crops with each year. This is probably because with each year we learned how to take better care of the garlic, as well as we selectively picked the best garlic to grow each year. These are factors that you have to take into consideration.
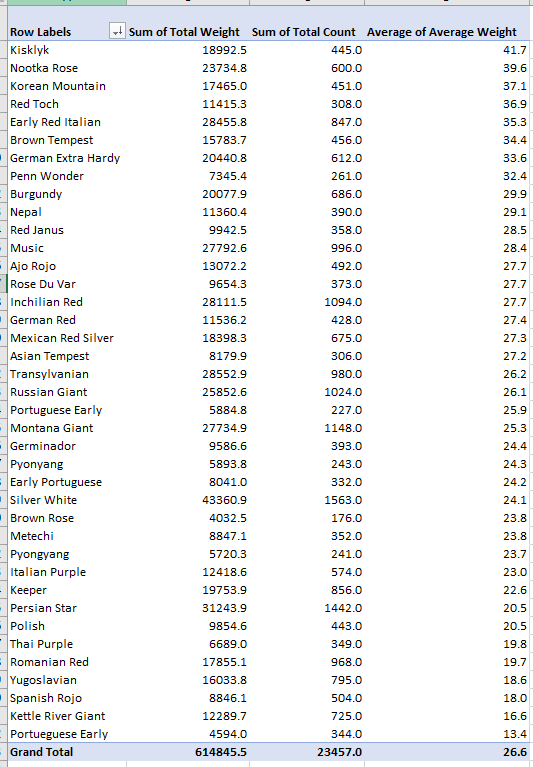
The final pivot table I made looks at each variety of garlic and is ranking them based on their average weight. We can see from this that on average, Kisklyk was the most successful variety. I like to have these numbers next to the total count and sum of the harvest weights because we can see the best producing garlic isn’t always the one that has the highest total weight. This graph shows us that Silver white is our highest producer because we also happened to grow way more of it then our other varieties.
In the end this process of creating pivot tables can give us answers to our experimental questions. However it also leads us to more questions, which we can answer with further experimentation or reasearch.
-Jack Swenson
Sankey Visualizations
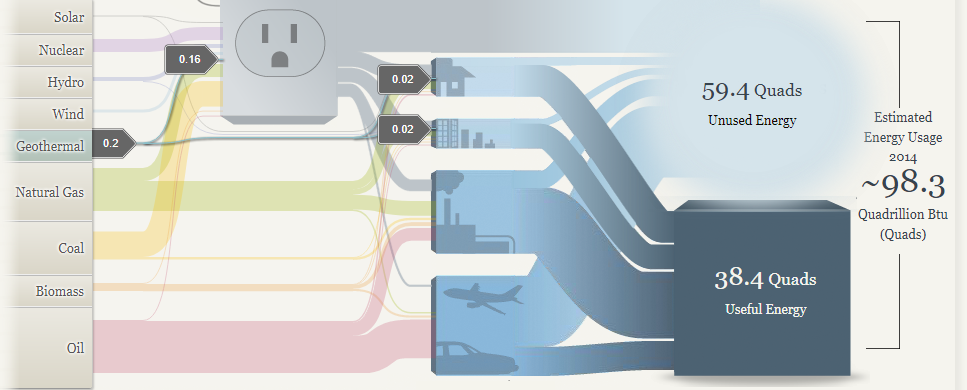
I think the Sankey graphics have some upsides and downsides. I like the interactivity of the website, and I feel like in certain ways it can give you a good perspective of the energy breakdown nationally and regionally but other places it starts to faulter. In particular I don’t like the vagueness of how certain energy streams translate to used and unused power. In the first picture you can see that geothermal energy accounts for an extremely low percentage of total energy usage nationally, but then the avenues that it goes down have varying degrees of how much power is unused. When you have this discrepancy it’s hard to tell how efficient each power source actually is.
I do like the energy breakdowns for the regional map because I think this chart makes it easy to draw some conclusions about the plausibility of renewable energy reliance. As a disclaimer I am a large proponent of sustainable energy conversion, however, I think from the below two pictures you can see that this isn’t an easy task. Especially when you look at where the sources are going. The transportation sector is still dominated by oil, so there is a significant amount of progress that needs to be made in creating more efficient energy systems that can support the use of clean energy.
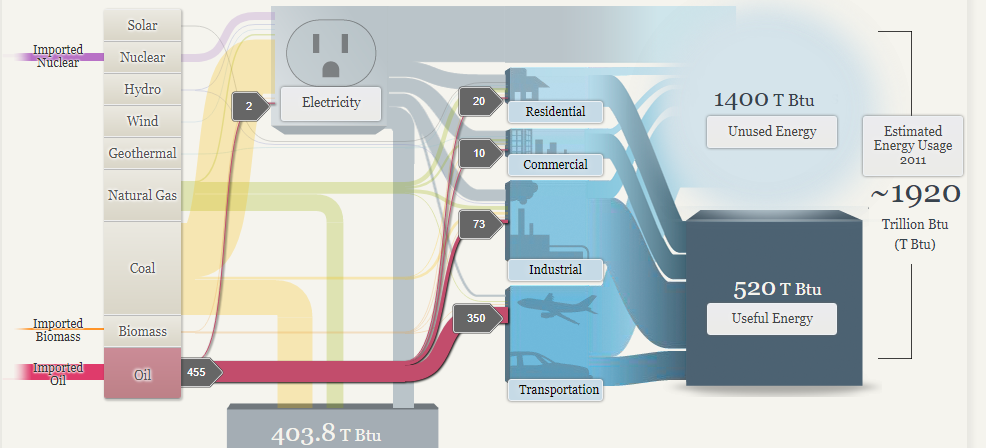
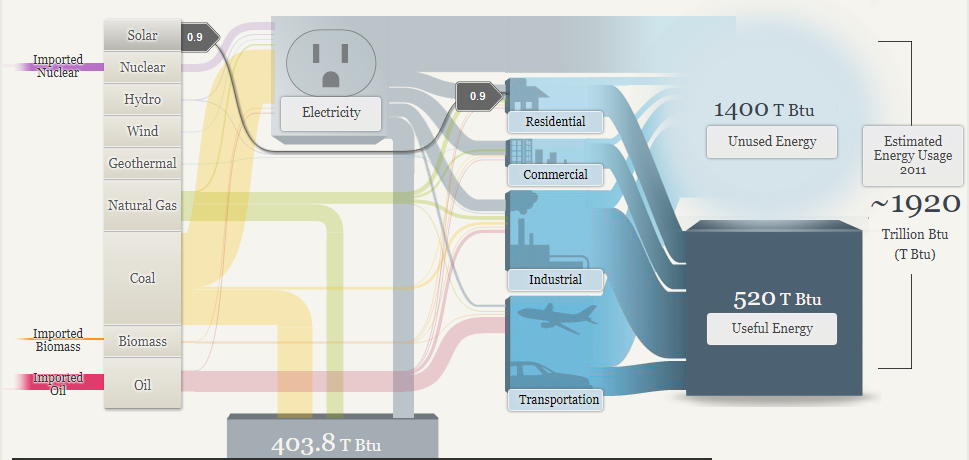
In conclusion I think that this website does some things right and some things wrong. A chart is supposed to guide the audience through the data that’s compiled, but I found myself questioning how accurate the numbers were, and without a lot of context for how much energy “.9” or “300” meant, it was hard to see the magnitude of differences. In terms of layout I thought the chart did a good job of graying out what wasn’t being actively clicked on, and that helped guide my eye through the different pathways that would otherwise be tangled up with each other.
-Jack Swenson
UN CONTRIBUTION: Pie Chart Edition
Pie charts are a difficult tool to use because they require very specific scenarios to be the most applicable. For my perfect-use case I decided to display the contributions of countries to the UN budget, shown as a percentage.
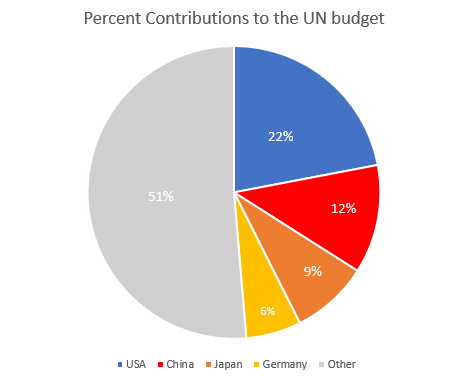
I think this is a perfect data set to use a pie chart because it’s simple and doesn’t have an excess of labels. This data set as it’s shown tells you that the US contributes almost one quarter of the total UN budget, and that the top four countries combined contribute nearly as much as the remaining 130 members combined. You may be able to add a fifth or sixth country to this pie chart, but then you lose the 50:50 narrative that is very easily read here.
Source: www.auswaertiges-amt.de/
-Jack Swenson