Importance of Pivot Tables
Pivot Tables are an essential tool in Excel that are useful for organizing and grouping large amounts of information. They are extremely versatile and can be used for a numerable amount of ways. By using pivot tables you can turn clumps of data into meaningful and insightful information that can be used for analysis. Some practical uses are in finance analysis, sales analysis, product information, inventory analysis, and more.
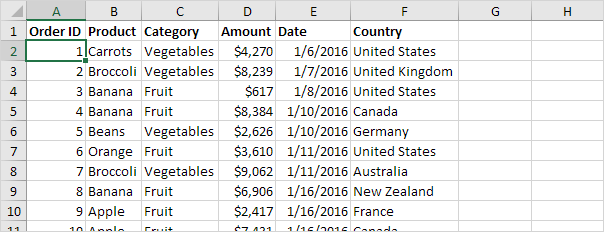
Above, we see sales analysis for produce. It is well organized and easy to interpret.

Above, we see another practical use of pivot tables for sales analysis. We can see here the sales for each product, the year it was made, and the category each product falls under.
Overall, pivot tables are useful for anything that needs to be organized into multiple different categories. From there, you can filter using the drop down arrows that prove to be extremely useful with many entries. Since in Excel, you can then make charts and other analysis more readily.
SANKEY Visualizations

A SANKEY diagram is used to show the connections between different values. In this case this diagram is about our energy system. I think this is a perfect representation of when a SANKEY diagram should be used. There is a variety of values here that are interconnected. In this diagram in particular, the viewer can see that oil is mainly used for transportation and industrial use. I can clearly se that coal is mainly used for electricity. I believe these diagrams could get a bit confusing, however, here it is clear with the different colors to indicate the values of the sources of energy.
Pie Chart Uses!
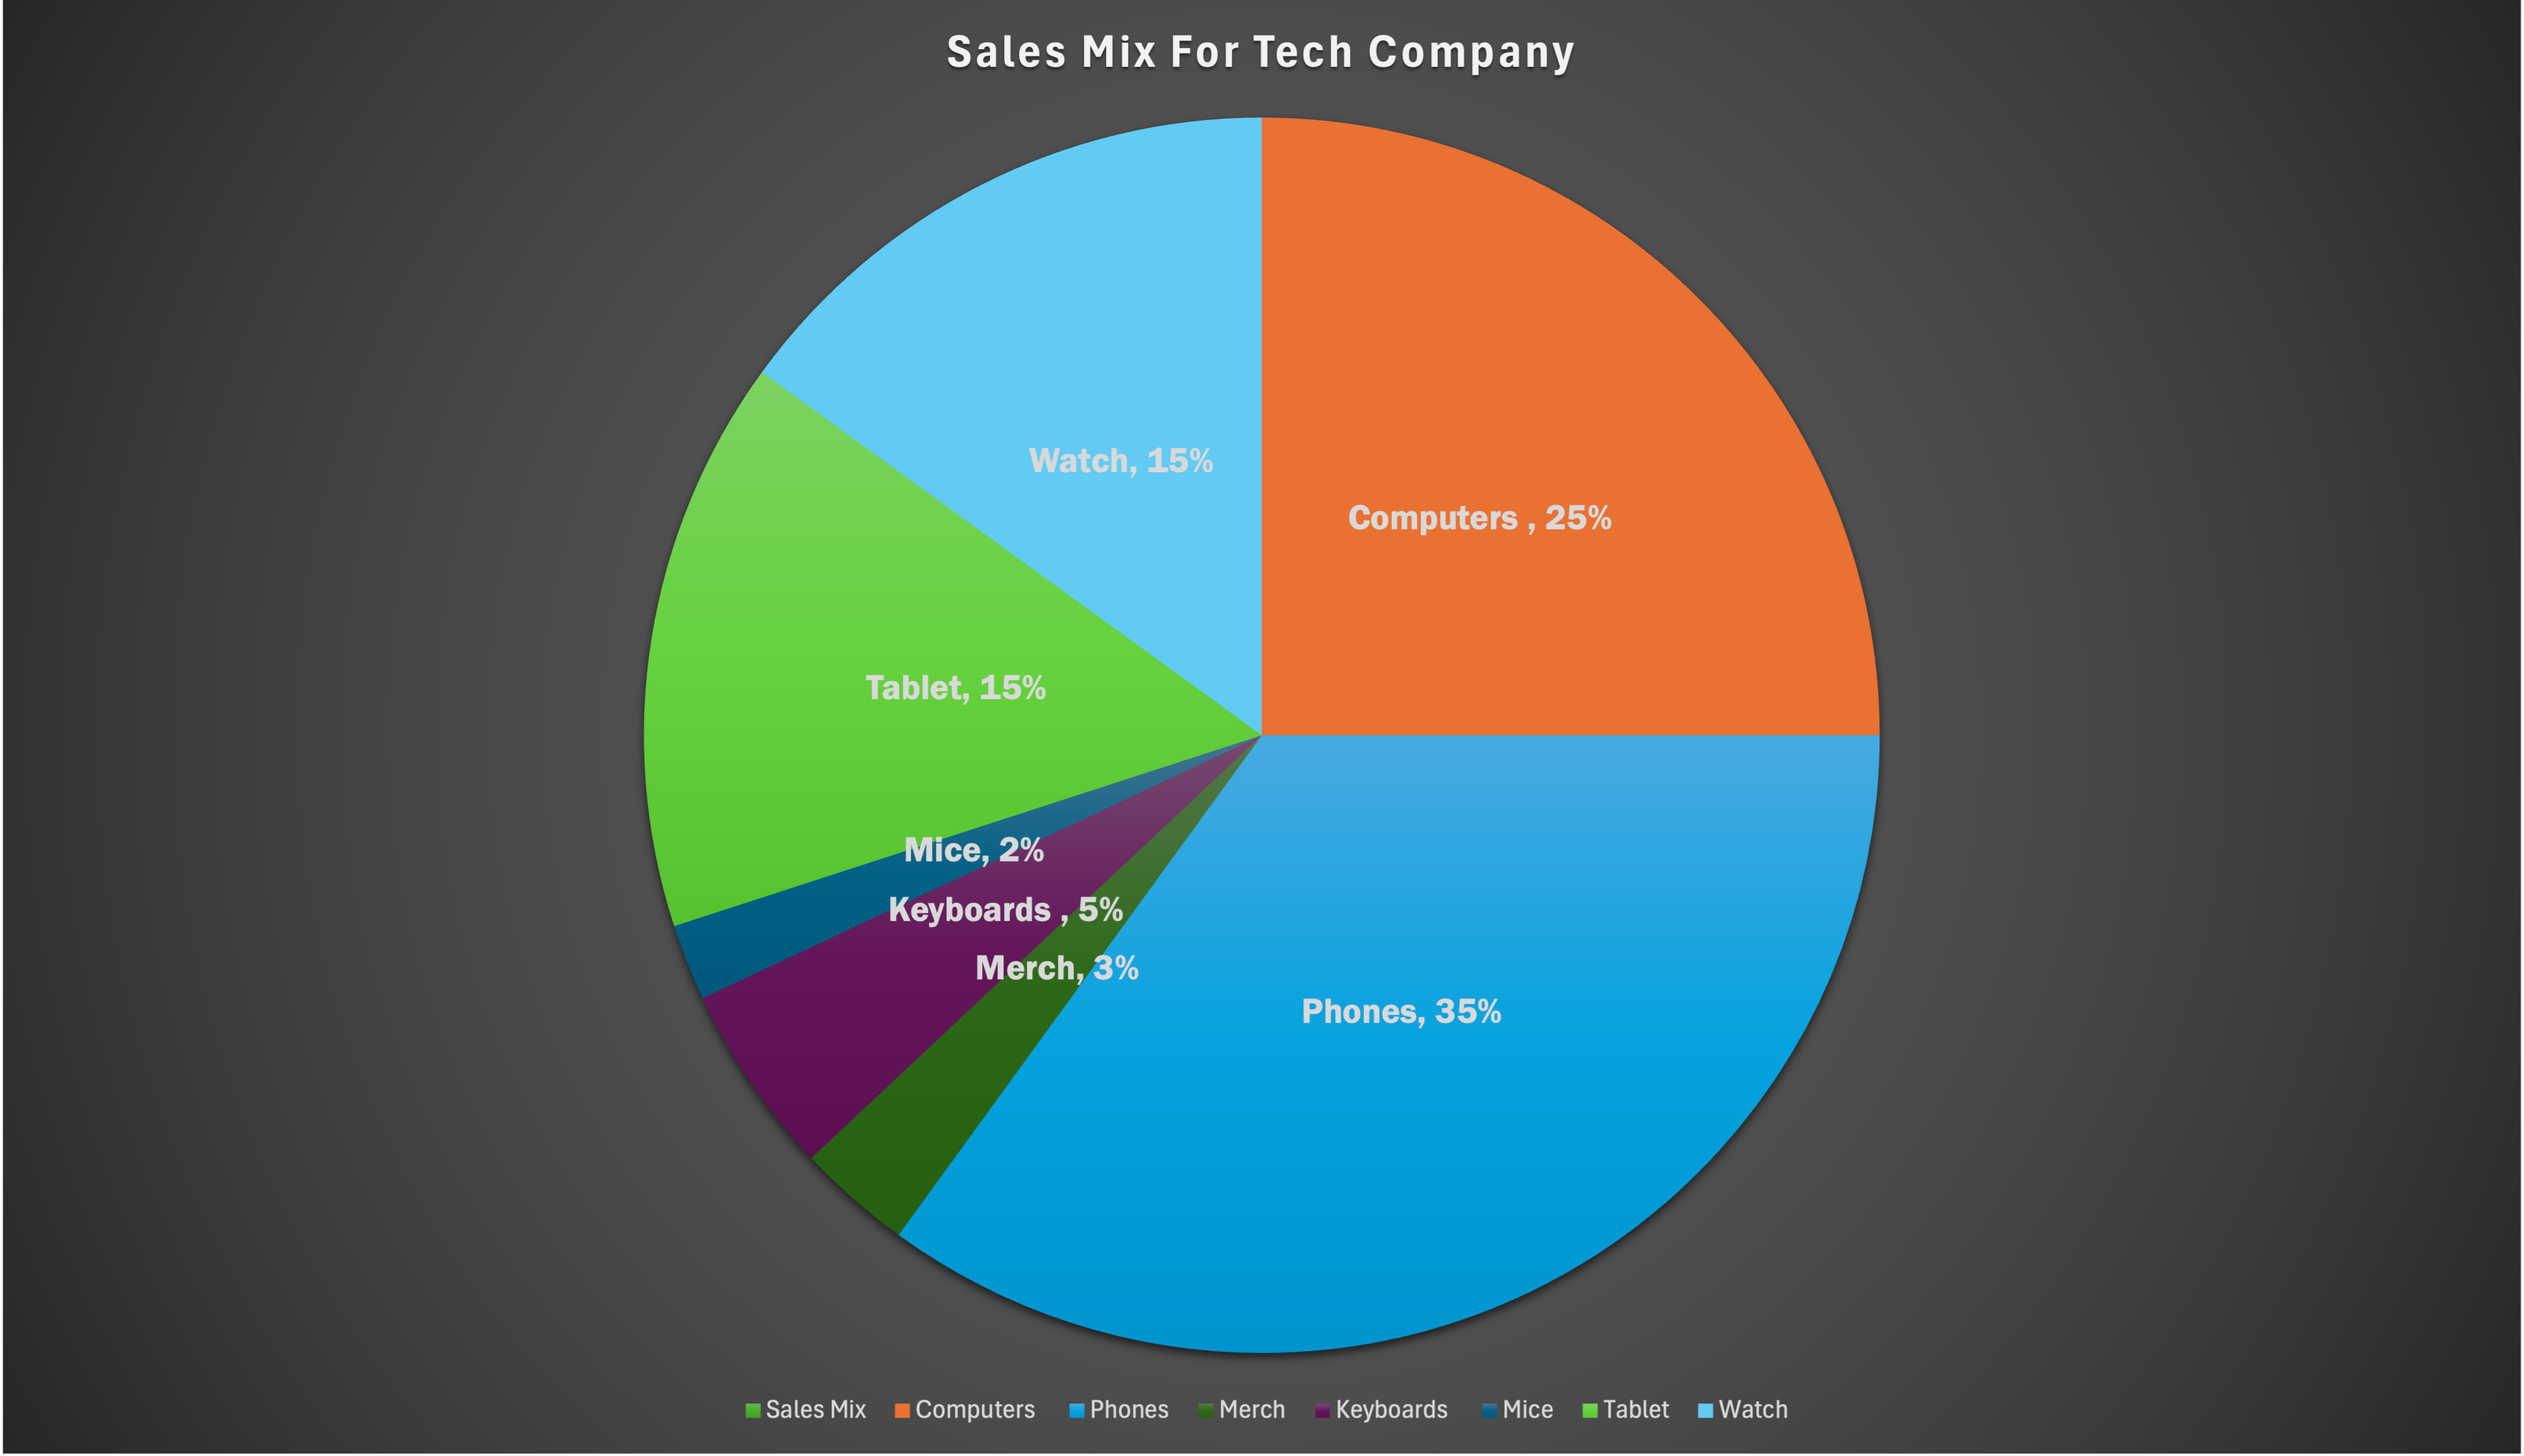
A perfect use case for a pie chart is total sales mix for a company. Pie charts are most useful when there is a part to whole relationship. When discussing the total sales mix for a company, each product sold for the company is a percentage of the total, 100%, of sales. For example, I made a pie chart for a fictional tech company whose sales mix are made up from computers, phones, tablets, watches, and so on. I made my chart in a way where you can efficiently differentiate the products from one another by using different colors and labeling them in the legend. I also added data labels and the percentage inside of the slice, for easy accessibility and to accurately show the percentage. Could you use other charts for this data? Yes! However, other charts would not be able to show the part to whole relationship as this pie chart. If you used a bar graph you could see the same data, but you would not be able to visualize that each part is made up of a total 100% of the companies sales mix. This is why using a pie chart for this data is so great!
Lollipop Chart
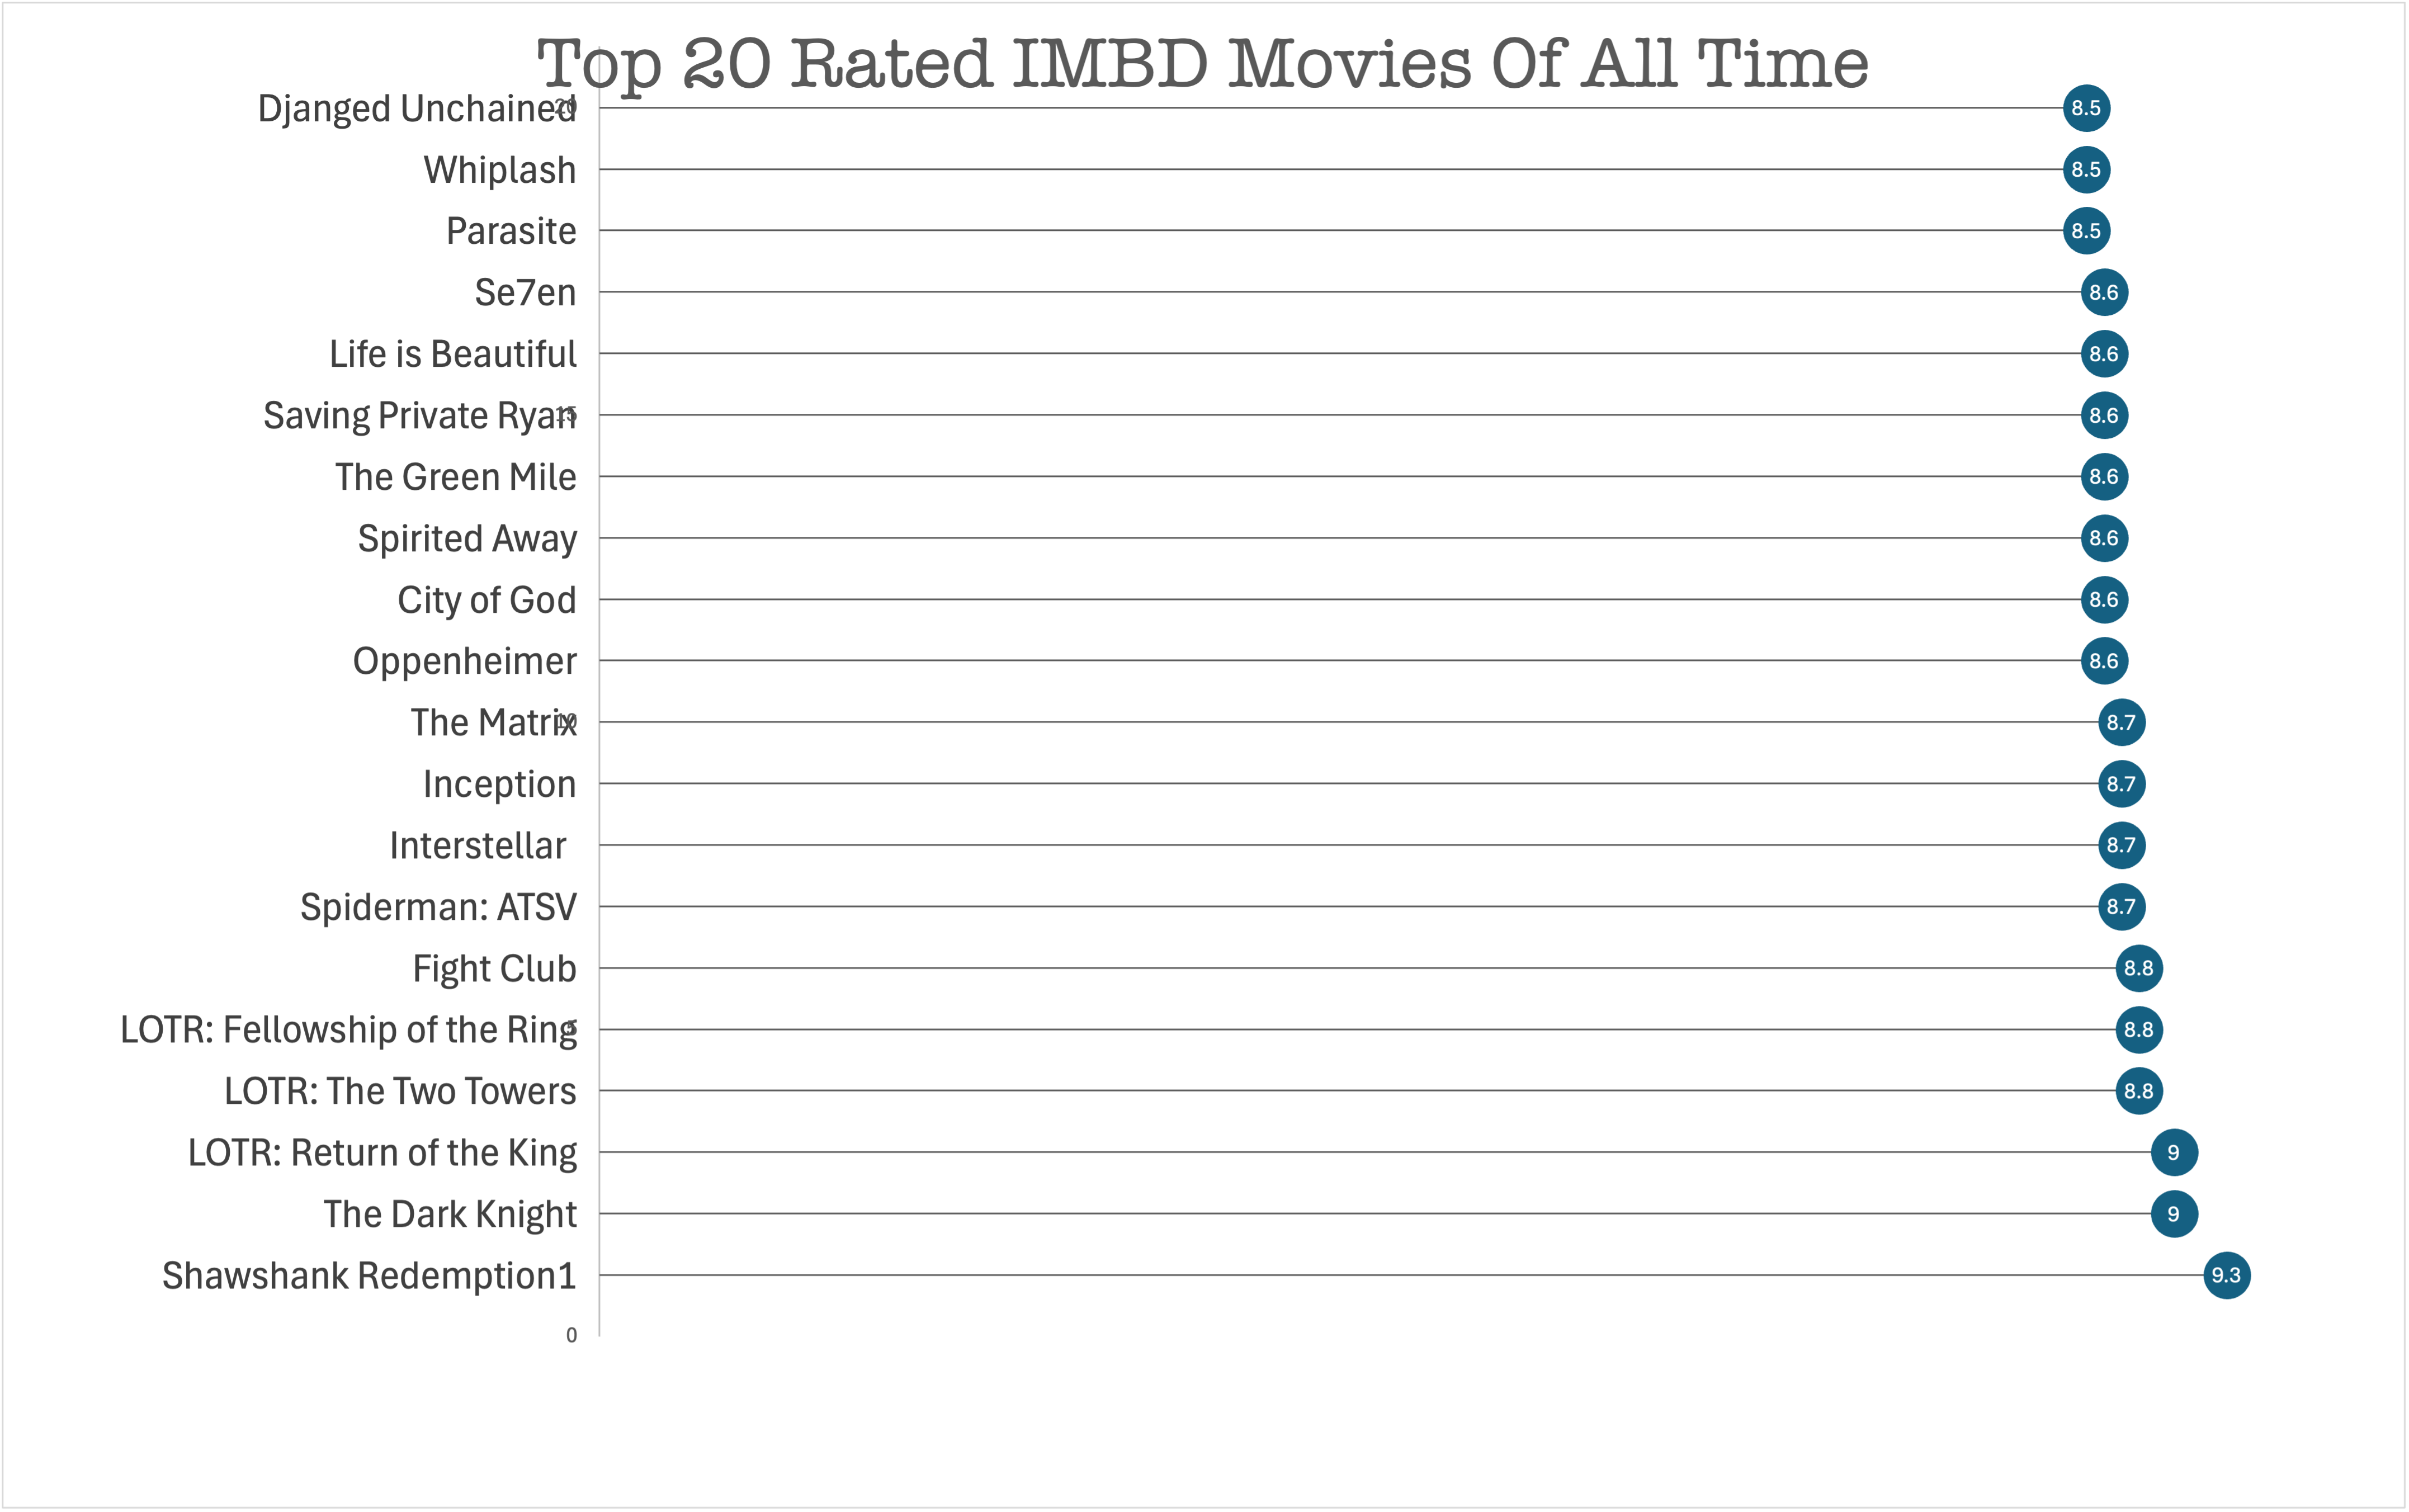
Lollipop charts are a type of bar chart that put a unique twist on your average column or bar chart. This type of chart is particularly useful for highlighting data points and their values and making it easily accessible for the reader to compare data. Lollipop charts are most useful when comparing data, emphasizing data points, and making aesthetically appealing graphs. Lollipop charts do the same job as bar graphs, however, they are more fun and highly the numerical values. I decided to make a lollipop chart in excel using a data set regarding the top 20 rated IMBD movies of all time. In this particular dataset the exact rating of these movies could be lost if the numerical data point isn’t clearly visible, therefore, a lollipop chart is perfect for higgling each individual rating.
Benchmark Comarpsions
This week in Chapter 4 we reviewed different ways to present benchmarks to show comparisons. Whether it’s a dashed line, or outstanding color, or even a dot, there are many ways to show the comparisons. They are extremely useful for comparing actual data to an average or target and provide useful insight on forecasting, trends, and success rate.

For example, here we have an infographic comparing the monthly change in jobs in the US. In this particular graph, the bar that is a different shade acts as the benchmark result. It is clear and concise and is useful when comparing to the other graphs. This article is from the New York Times.
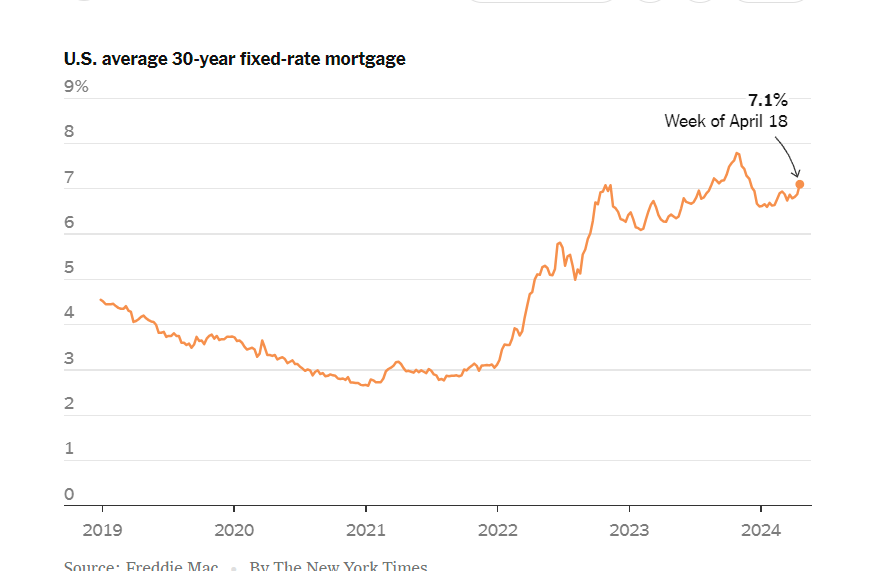
Another example from The New York Times, is the rates on a 30 year fixed rate mortgage. This dot serves as the benchmark for the graph. It is easily identifiable and shows the trends of the mortgage rates.
How Much Do You Save From Driving An EV Car?
Not only does driving an electric car decrease your carbon footprint, you also save a bunch of money! But exactly how much money should you expect to save? It’s about half as expensive based on cost to travel per mile according to my source.
EV Cost Savings
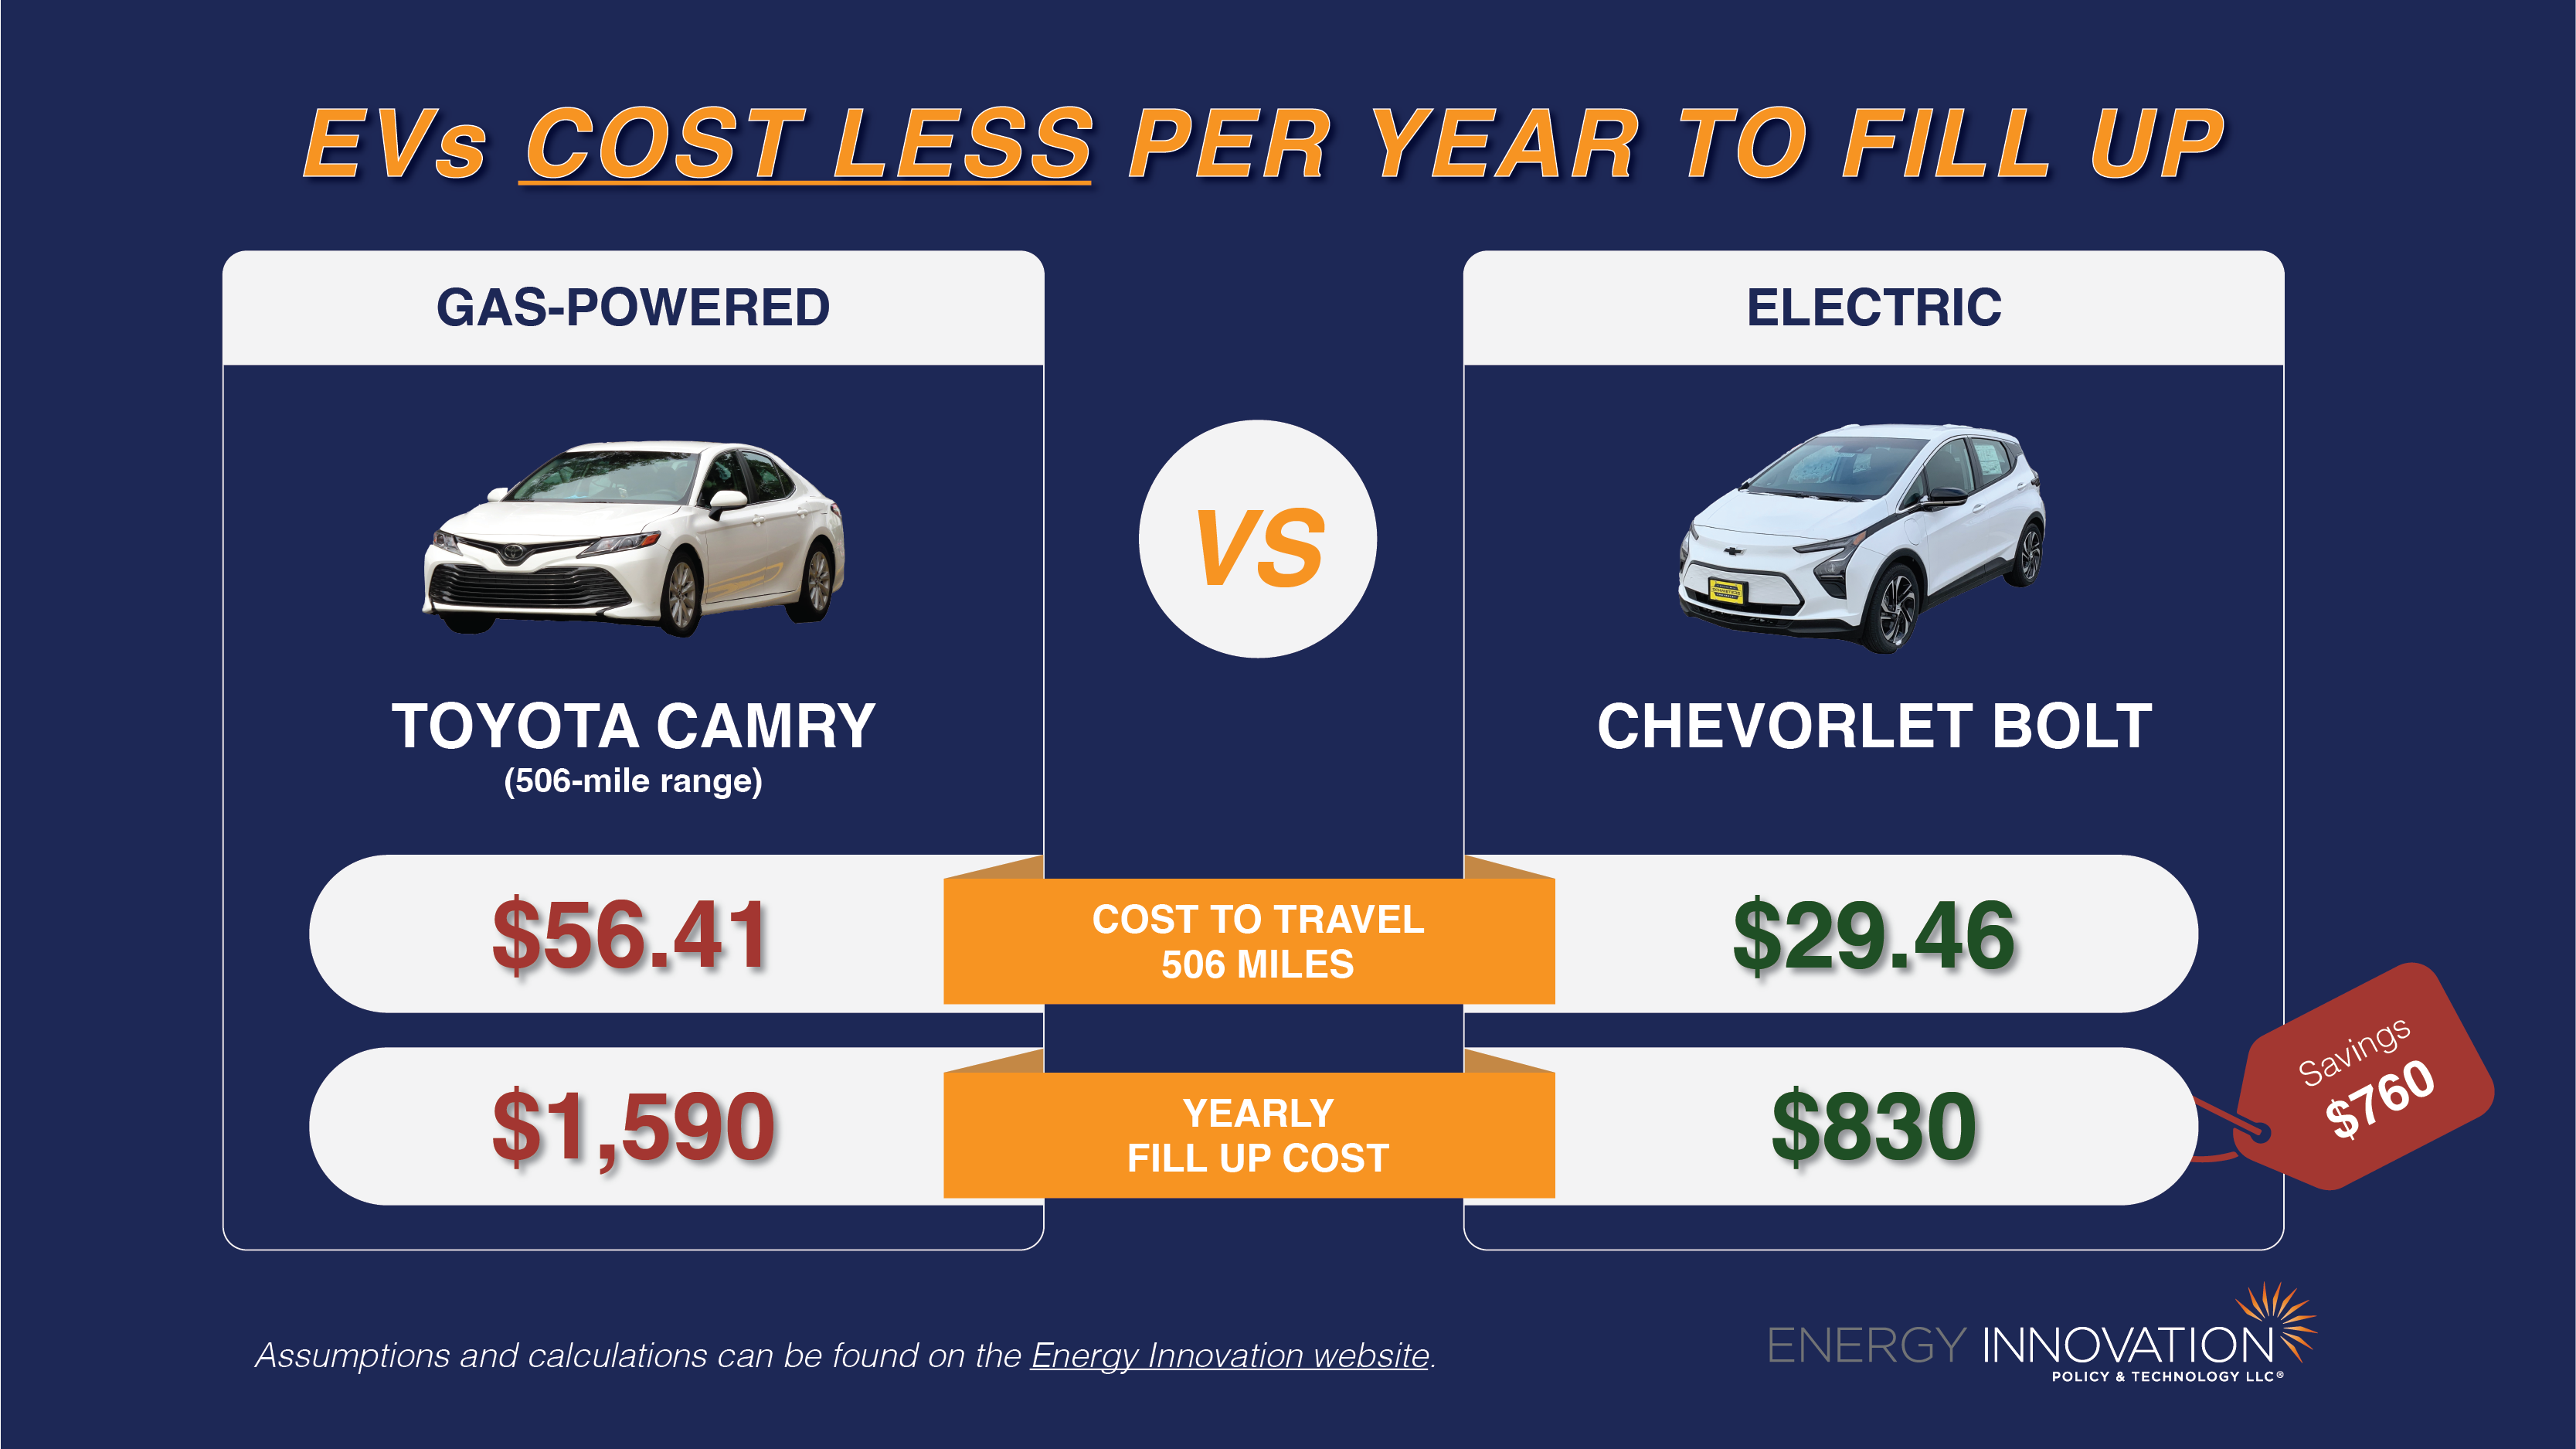
As seen in the image above, the cost to travel approximately 506 miles for a gas powered vehicle, in this case the Toyota Camry, is about $56.41. For the electric powered Chevrolet bolt, the cost to travel is $29.46. This is about $26.95 in savings. This means that you are almost able to drive 1000 miles with the same cost as the Camry’s $56.41 for one tank. This money adds up to a noticeable difference. The yearly fill up cost on average for the gas powered vehicle is approximately $1,590, whereas the electric is at a frugal $830. This saving is $760! Based on my calculations this is about a 47% savings per year when switching to electric vehicles. This is solely based off of traveling costs, so this excludes oil changes, other maintenance of gas powered vehicles that electric vehicles do not have. Overall, the savings from driving an EV car are significant.
Visualizing Health
Upon navigating throughout the website, the importance of the tools and calculators on this website became apparent. I started at the risk calculator, where you enter different demographics that will compute your risk of cardiovascular disease based on the Framingham Health Study. Although this calculator may not be accurate for everyone, it provides an estimate that could be used as a baseline for your health. A tool like this could be used as an awakening for someone; Someone who enters their data and realizes that they may be a high risk, may decide to change their lifestyle.
Here is the visual and data I received after entering my demographics.

As you can see, based on the risk calculator my likelihood of developing a cardiovascular disease in the next 10 years is about 2%. I then used the icon array to put more perspective on my data.
This visual shows the percentage of people with similar demographics as mine that would be likely to develop a cardiovascular disease within the next 10 years (out of 100).
Like I said before, this tool can be used as a great estimate for people’s health. Overall, I believe this website is a step towards modernized health support.
Examples Of “Good” Infographics
Infographics are a great tool for learning, retaining information, and organizing data sets to efficiently display information. There are infographics that can be considered “good” and some that can be considered “bad”. In this blog post I will share what makes a good infographic.
A good infographic often presents complex data into a more clear, simple, and concise way. A good infographic should use its visuals to help the audience interpret the main ideas through storytelling. Most importantly, a good infographic should be useful to the viewers.
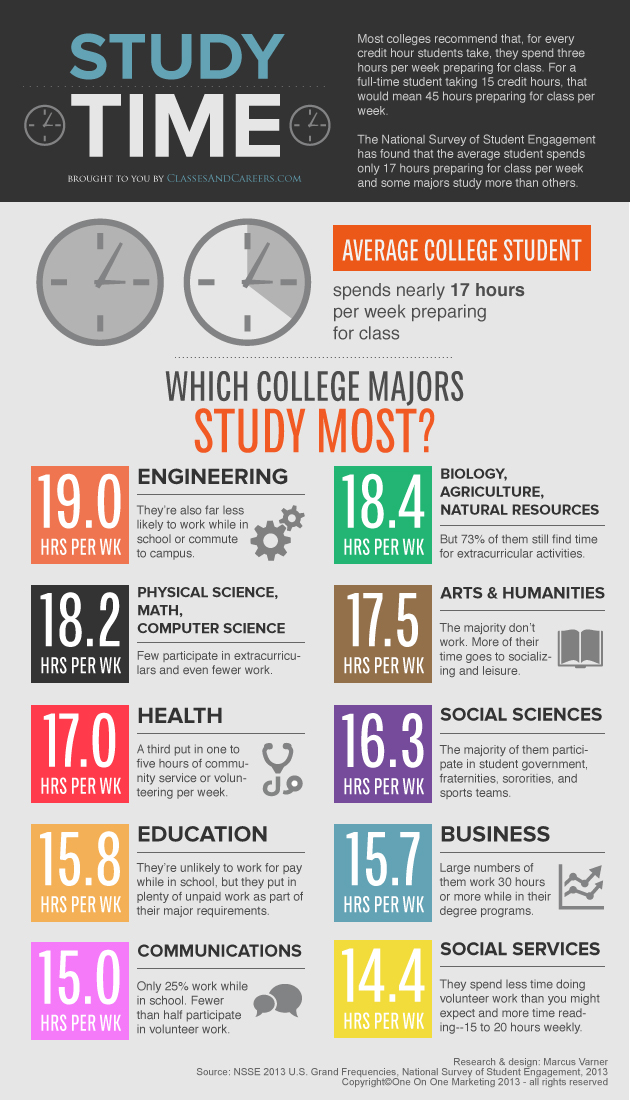
In this infographic on which college majors study the most, takes data that would most likely be very complex on a data sheet, and turns the data into a concise yet comprehensive story that displays the information readily available to the audience. This infographic is clear, easy to interpret, and tells the story on study times. Above all, it is useful information to the intended audiences.

This is another example a good infographic, that displays information clearly, effectively, and is useful to the intended audiences. It tells the story of students and what their weeks consist of. It utilizes good visuals that help the reader interpret the data effectively, making it a memorable visual.
These graphs are great examples of insightful infographics. They’re useful, clear, effective, and display comprehensive data sets that are now easily interpreted by the audience. This is what every good infographic should look like.