Blog 7-Pivot Table
As someone taking an accounting course. I’ve used pivot tables before because they’re an easy way to summarize large amounts of data so they’re easier to read. The table categorizes the information and summarizes the results. This item is an important feature that helps in business as it can show if a product is worth making or which department is making how much revenue. This visual is more of a table and lacks a visual.

Please see table above for example of Pivot Table. From reading this table, it talks about the four different reseller and their sales on fruit. Sally did well for the Month of September, but Mike sold more than Sally in the overall 3 months.
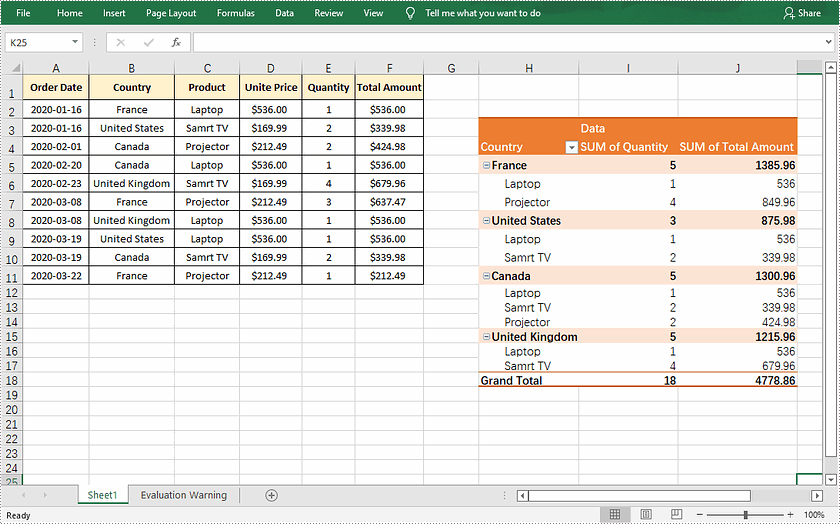
This table is showing the difference of laptops , Tv, and Projector sold in France, US, Canada and the United Kingdom. As the Pivot table shows the grand total and it is easier to read to know how many of each thing was sold, the amount and the Country.
Overall, Pivot Tables are able to read and a wonderful tool.
Data Visualization Commentaries/Blog Content
After spending over 10 minutes wondering whether I like this blog and visualization as someone who cares about the environment, The website does seem confusing at first as it took a while to find the, sanity for our energy system. Honestly, it was great fun playing around with this blog as I loved clicking on the word text.
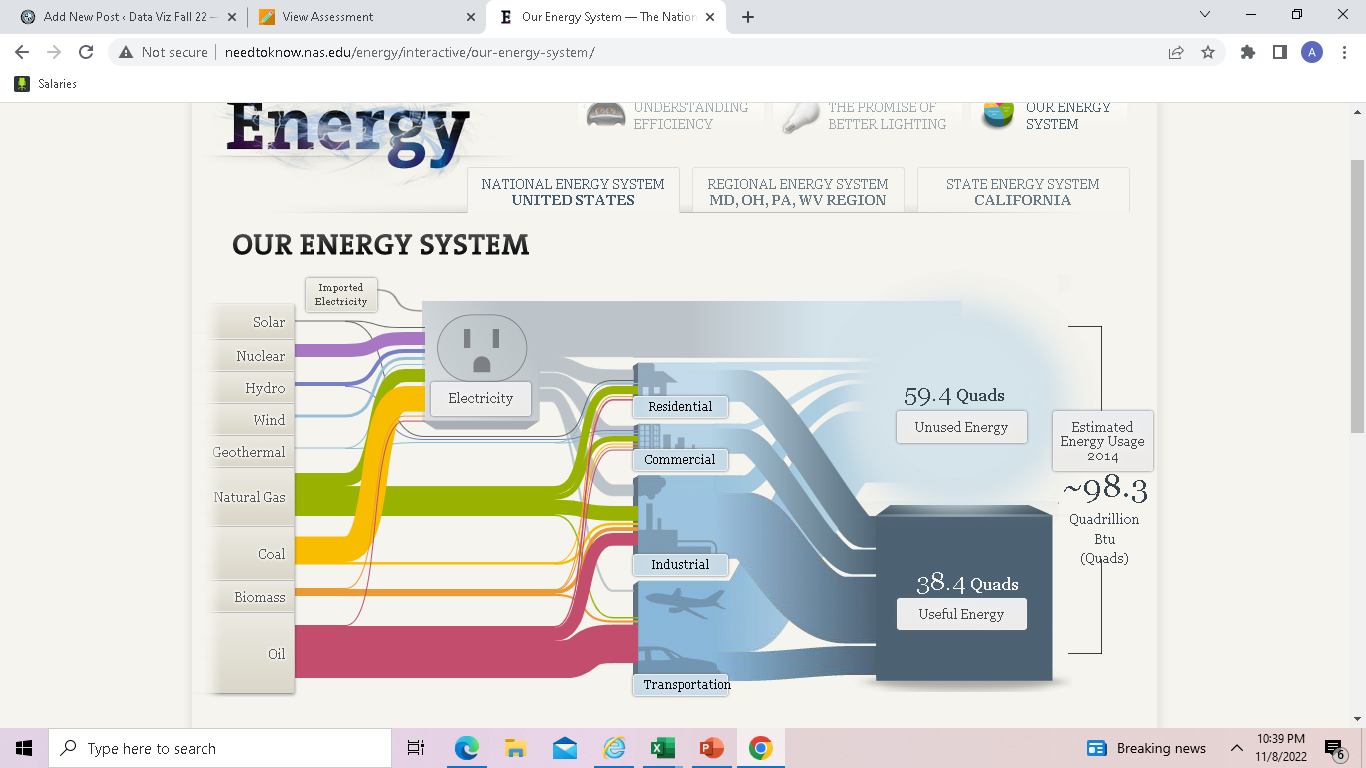
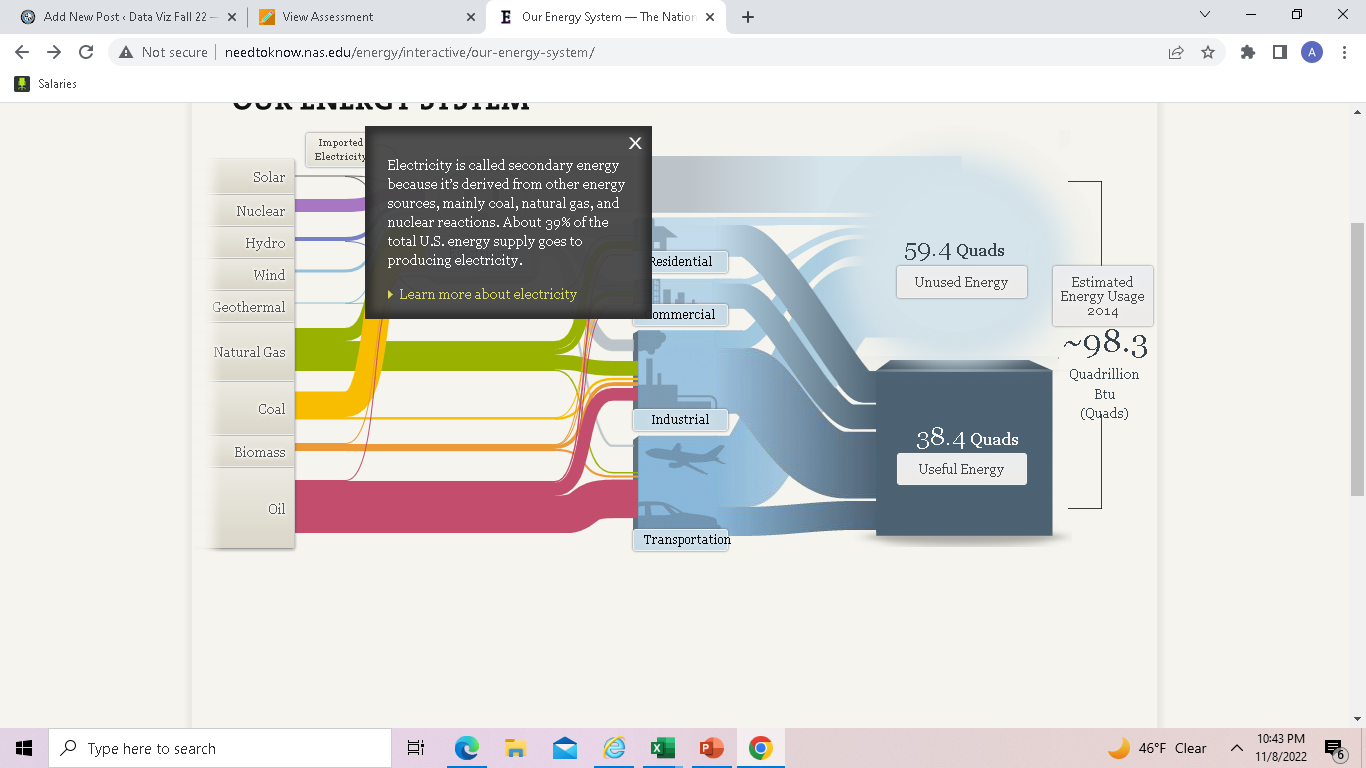
After clicking on the word text, it gives you more opinions to read. More about it, which was, honestly it was pretty entertaining and cool. I like how they used a surge protector, which was very creative. It did keep it interesting.
Then when I clicked on the solar, it was almost a circuit which was cool and very directive. Which I then thought, this site has put alot of effort into their website. I did enjoy this blog greatly.
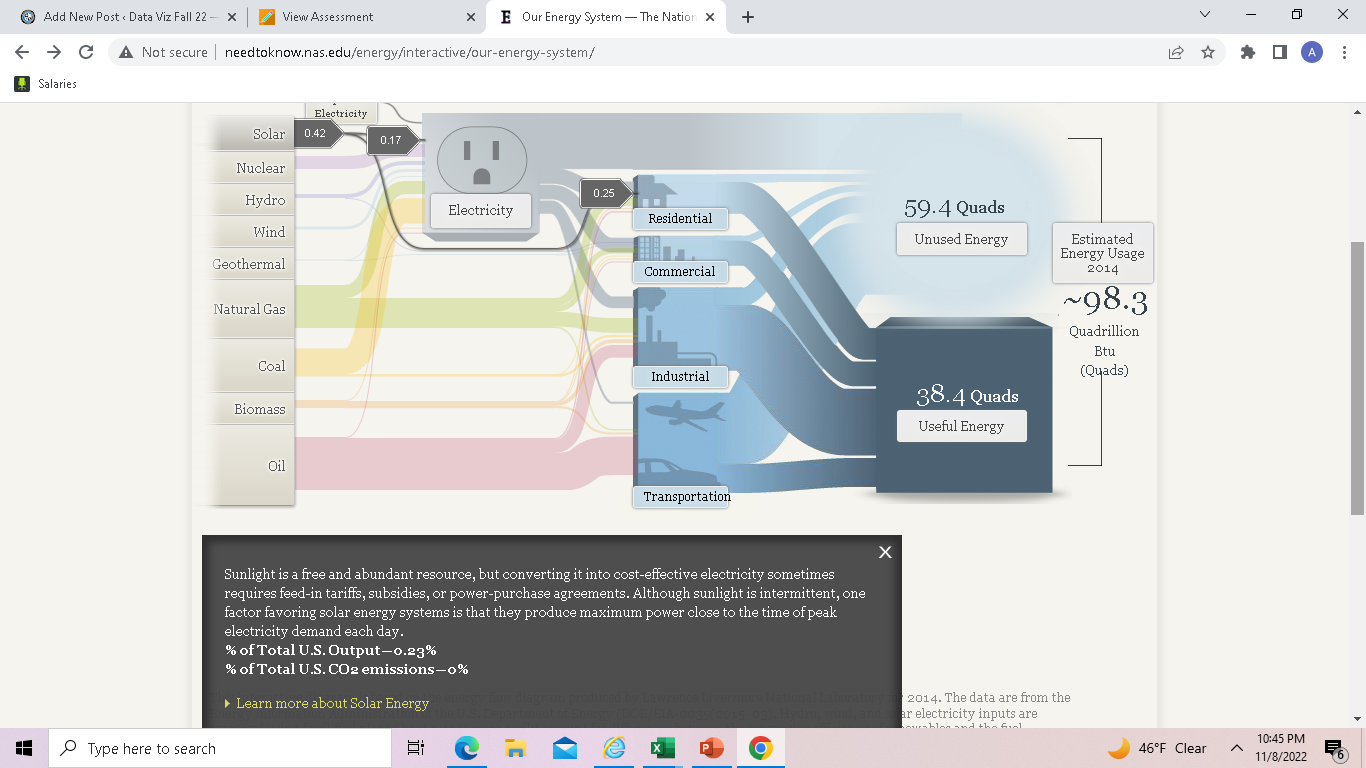
I think I would like to use a sankey visualization in my future projects as it helps show the flow of a project.
Pie Charts
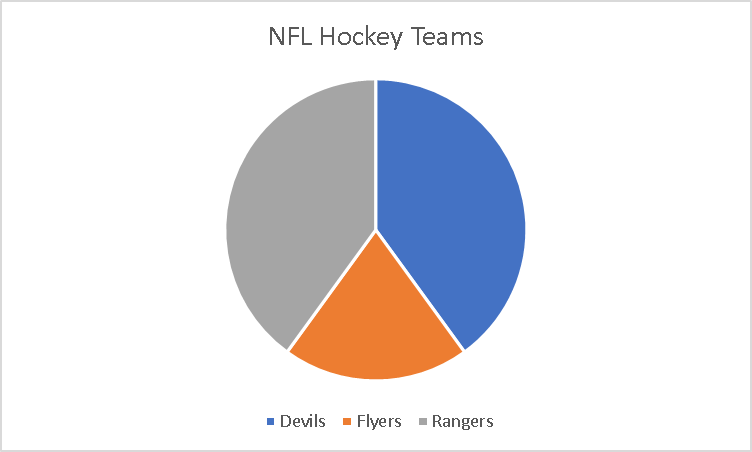
A pie chart is to summarize data almost a piece of a whole. As when the word pie reminds me of a circle as it will always need to equal 100%. Each slice of the pie is component of the whole.
I took a small poll amoung my friends on which teams they prefer. It was made of small poll group between three teams that were major in the New Jersey area and the poll was taken by 10 people. It has very visualizing pleasing as it doesnt look like it is missing . It is making up a parts of a whole where the whole is the Major NFL Hockey Teams in the area and it was split into three so the subparts.
I would sugguest using these types of charts if it is to display something like this. I also would like to also put different colors of the pie chart instead of the same color to defferentiate the different teams.
Lollipop Chart
When thinking about a lollipop , you tend to don’t think of a chart. Some people compare it to a bar graph, but it is slightly different as it a line and a dot, which gives it the lollipop shape. Not an actual bar and many people comment that there is no distinct different besides the shape. The chart is actually used to compare categorical data. I think it gives a different dimension and a fun way to show data.
See below for the table I created for this table.
| Ice Cream Toppings | Percentages |
| Fudge | 20% |
| Rainbow Sprinkles | 33% |
| Caramel | 13% |
| Pineapple | 0% |
| Chocolate Sprinkles | 33% |
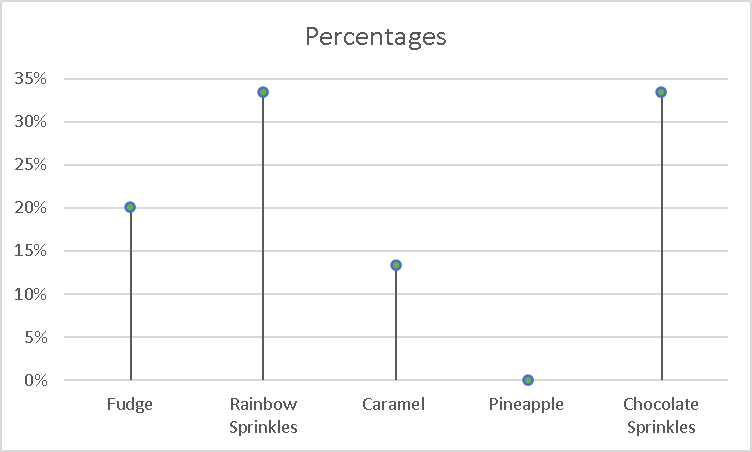
This was a fun in making. Will be using this type a graph again!