Pivot Charts
An interactive method for instantly summarizing a lot of data is a pivot table. Finding patterns and trends, organizing data, creating reports, and being more efficient are all made possible by pivot tables. These are a helpful tool for analyzing and summarizing a lot of data. Pivot tables are also a good way to make sure that your data is automatically staying up-to-date.
In this example below, it shows Raw Data vs. Pivot Report. As you can see, the data in the Pivot Report is much more organized and clear to read than the raw data. The data is condensed into a less complex chart that is interactive and automatically updates calculations.


Pie Charts
The ideal uses for pie charts are to illustrate the corresponding ratios of components to a whole and to demonstrate how a whole is divided into its individual pieces. When properly sized categories are present pie charts can be used for straightforward, equal comparison. For more in-depth comparisons a bar graph would work better than a pie chart. Labeling, ordering, and limiting slices are some tips when creating a pie chart. When labeling, verify that the appropriate number or percentage is written on the label of each slice. To keep a pie chart organized slices can be arranged from largest to smallest or smallest to largest. Use a different chart type if the chart includes more than five slices to limit clutter. There are certain cases where pie charts are not the ideal option. When there are too many categories in the data or the data values are too similar a pie chart would not be the best fit. If the data contains any values that are not positive integers, a pie chart is not the right choice.
Below I have included a good example of a pie chart that is properly labeled, ordered, and contains limited data.
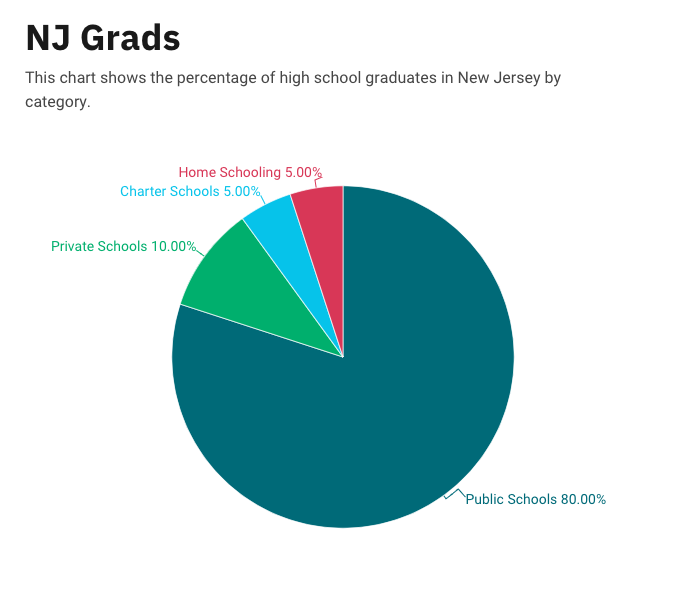
Pie charts provide a clear visual representation of percentages and proportions, which makes it easier to understand data distribution. Making judgments based on data representation is simple with the use of pie chart analysis. Pie charts offer an immediately comprehensible visual depiction. Pie charts make it simple to compare different areas and provide information about those with the greatest impact. Pie charts are very helpful in the business world. They can guide investments and have an impact on plans for advertising and the creation of products. Decision-making based on data can be substantially improved by the use of pie charts and their interpretations.
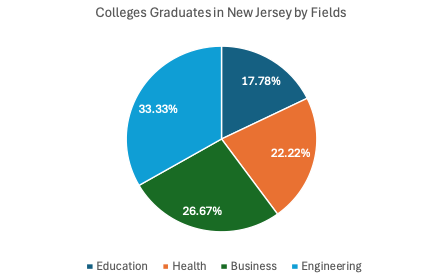
Below is a pie chart that I created in excel. It represents college graduates in New Jersey by fields.
Lollipop Chart
Lollipop charts are used to compare several objects or groups, similar to the purpose of bar graphs. They can be very useful in analyzing and visualizing trends. A lollipop chart can work well for comparing the values of different groups while accentuating individual data points, especially if some values are extremely high or low. They make it easier to identify deviations or substantial differences between data points. Lollipop charts should not be used for distribution or relationships in data. The Lollipop chart that I created in excel is shown below.
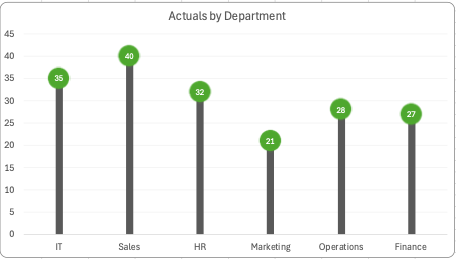
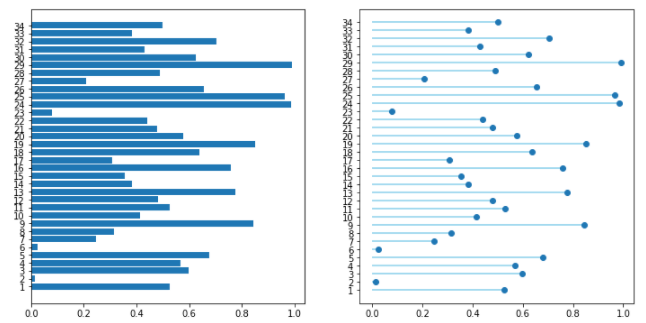
Lollipop charts are modified bar charts with dots representing points and thin lines for bars so that more data may fit in a smaller space. A lollipop chart is a good option for placing or focusing on specific values within a dataset because it minimizes visual clutter from crowded bars. The line helps guide the viewer’s eyes directly from the data labels on the x or y-axis straight to the data point value. The image shown below is a good example of how sometimes bar graphs can look cluttered with too much data. Using a lollipop chart takes some excess color off the screen making it easier to visualize the values of each data point for analysis or comparisons.
Benchmark Comparisons
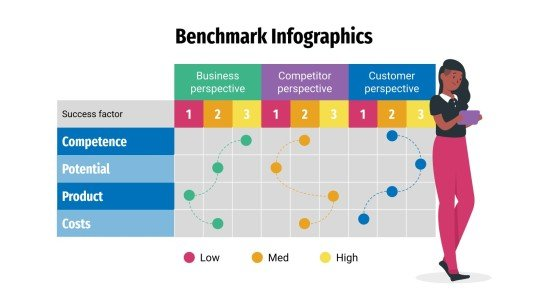
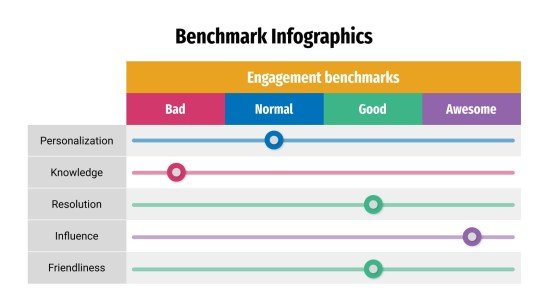
Visual components are used in comparison infographics to compare two or more objects, such as ideas or products. They may be a useful tool for assisting individuals in the comprehension of difficult facts and making reasonable choices. By comparing a company’s operations to other businesses’, benchmarking infographics can help find areas for growth. Benchmark graphs illustrate how various groups, like nations or businesses, perform against one another by comparing statistics. For example in the image shown below, benchmark comparisons assist in evaluating the performance and quality of products, goods, and industries as well. As shown below through a series of procedures and tests, you can find out if your system is operating at peak efficiency or whether there are issues that need to be fixed.
Infographics may be used in a variety of ways to display comparisons to a benchmark. Comparison infographics are frequently used by marketers when comparing a competitor’s product against their own. A great way to compare two items directly is by using comparison infographics. Utilizing a range of charts while choosing the appropriate chart and including visual features are some strategies for using infographics to display comparisons to a benchmark. To illustrate how a topic performs when compared to several groups, use a scatter plot with a solid benchmark line, a stacked bar chart, or a pie chart to compare portions of a whole. An infographic may display several kinds of information using a variety of chart formats. A table can be used to arrange information so that readers can look it up, or a numbered list can be used to indicate rank or order. Infographics demonstrate relationships between data, procedures, or individuals through the use of visual components.
Comparing Numbers
An efficient way to visualize data is with comparison charts, which are clear and well-organized. By simplifying the data, they can help viewers see patterns among the variables. A person may choose a good or service more efficiently by comparing data points visually. Understanding complicated data is made much easier and faster with the use of comparison charts. Comparing numbers visually is a way to focus attention to connections and distinctions that allow for improved data analysis.
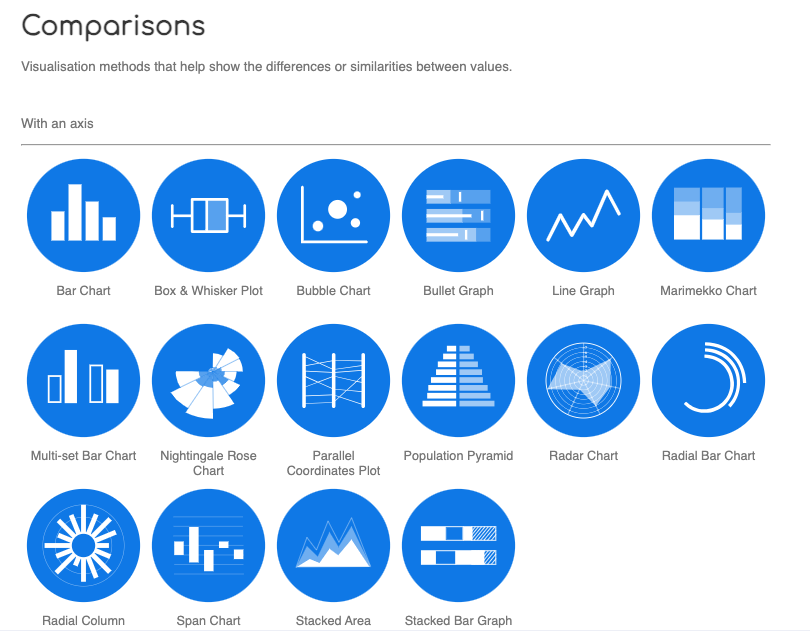
I found a website called the Data Visualization Catalogue. It is a great resource to have when trying to decide which chart is best to use for your data. This image above is a screenshot I got from the website, it gives examples of different comparison charts. If you click on any of the blue circles, the catalogue will provide a page full of details for each chart/graph. In the Data Visualization Catalogue an example, a description, and the anatomy of each chart/graph are shown in the details. A link to the website is posted below.
Tools for Constructing a Good Infographic
An information graphic is an assortment of graphics, data visualizations, and brief text that provides a clear summary of a subject. Infographics are easy to make and are the perfect balance when dealing with an abundance of information. In this blog post I will show examples of good infographics that provide a clear message without overloading information.
Clicking on the Infograph below will take you to the website where I found it!
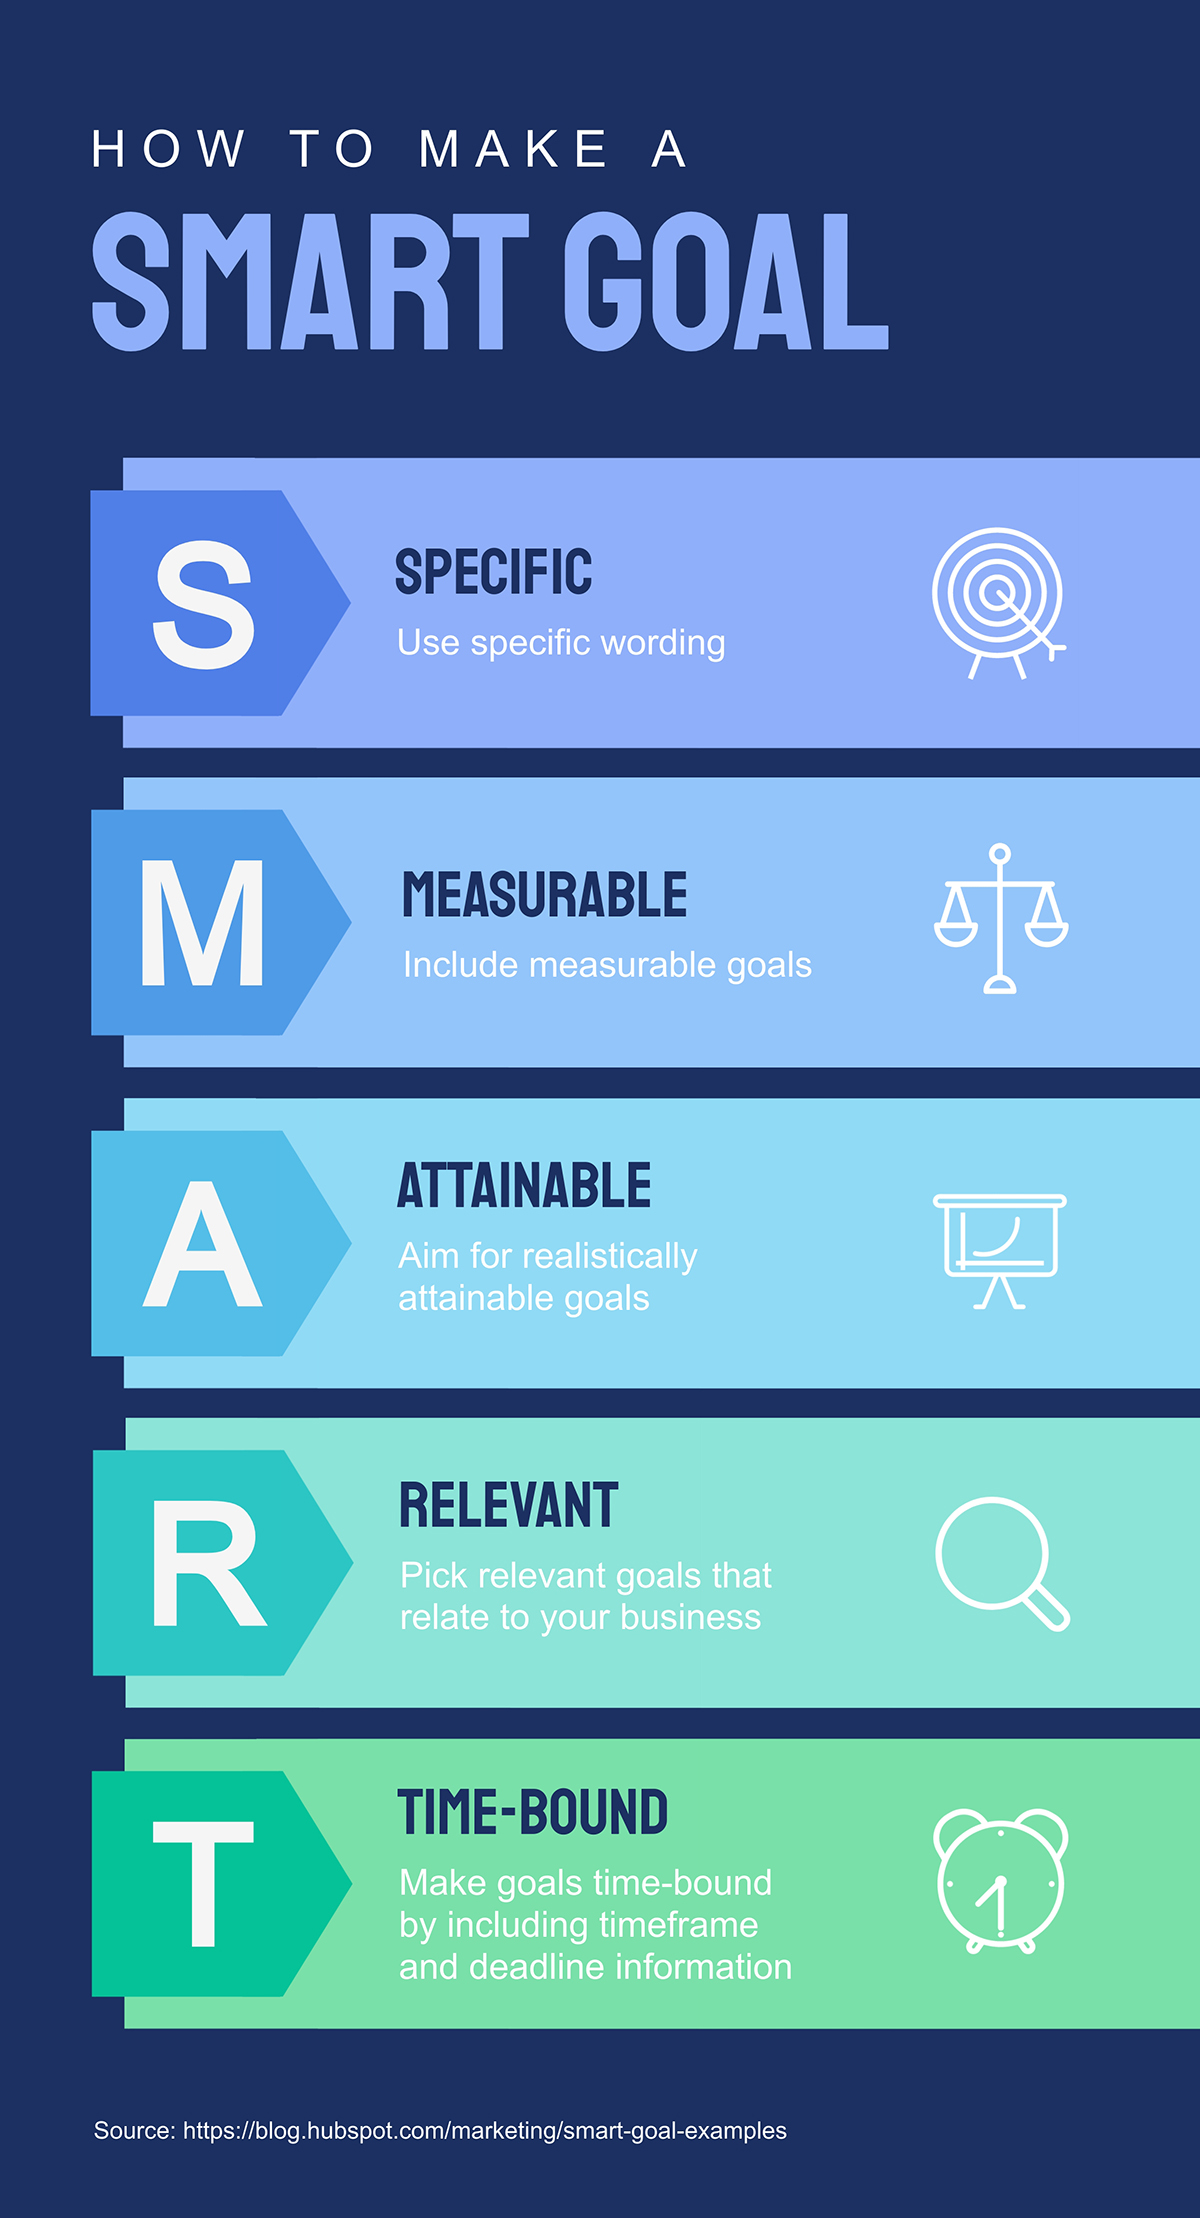
Infographics may be used for many purposes. You may share them on social media and post them on your blog. When creating an infographic, there are several internet resources available to assist. During this procedure, there are few stages that you should not skip. Creating an infographic outline, selecting a template, and adding your own customizations to your infographic are all important steps in creating a useful infographic.
Clicking on the Infograph below will take you to the website where I found it!
Sources
Health Visualization
The goal of visualizing health is to provide health professionals and other individuals who are interested in educating the public about health risks with direction and motivation. Widespread usage of this material has made it easier for medical professionals to communicate complex ideas to individuals who need clarification. There are many great options for presenting health data in Visualizing Health. Maintaining and improving health visualization is crucial for scientists, designers, and other experts. Websites like vizhealth.org can be helpful tools to use when visualizing health data.
On the left is a graph that shows how this website is a great tool for visualizing health. Being able to visualize medical data helps us to quickly understand our health. Diagnosis, statistics, and treatment plans can be difficult to understand without visual aids. It is important to stay informed when it comes to your health.