Pivot Tables
Before this class, I had no idea what a pivot table was. So by learning what it is and getting a quick lesson on how to use it, I believe it is best used for analyzing and summarizing sales figures and financial data. Here are a couple examples I found on the internet. 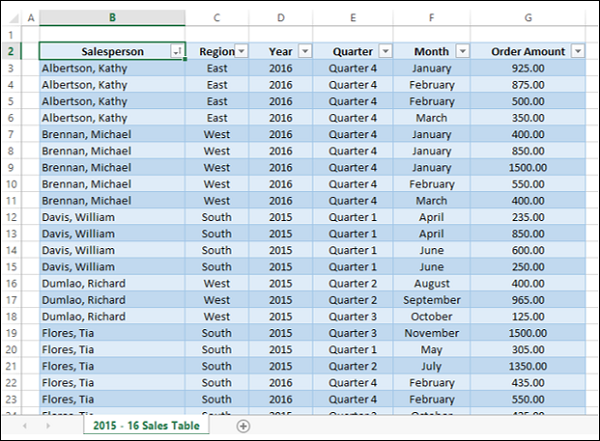
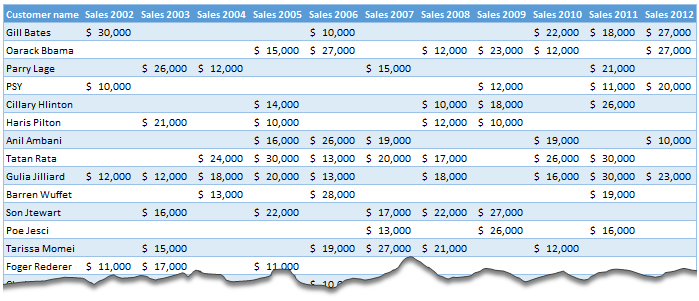
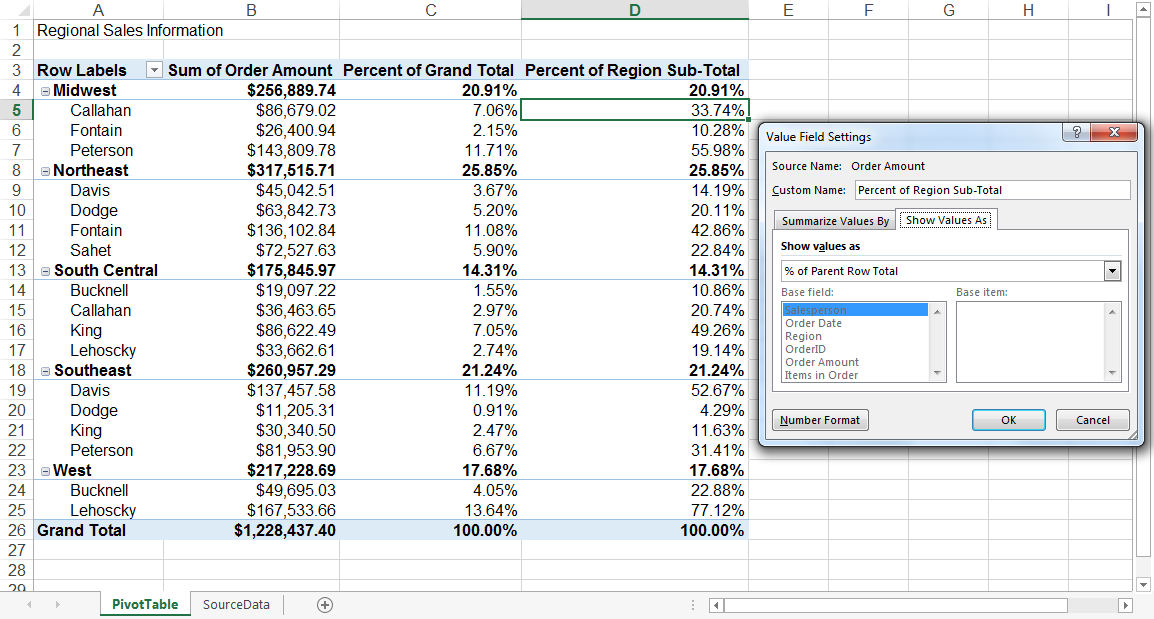
Pivot tables can save time by providing a quick and dynamic way to organize and analyze large datasets, allowing users to summarize information, identify patterns, and generate insights without the need for complex manual calculations. The interactive nature of pivot tables enables users to explore different perspectives of their data efficiently, making the process of data analysis more streamlined and time-effective.
SANKEY
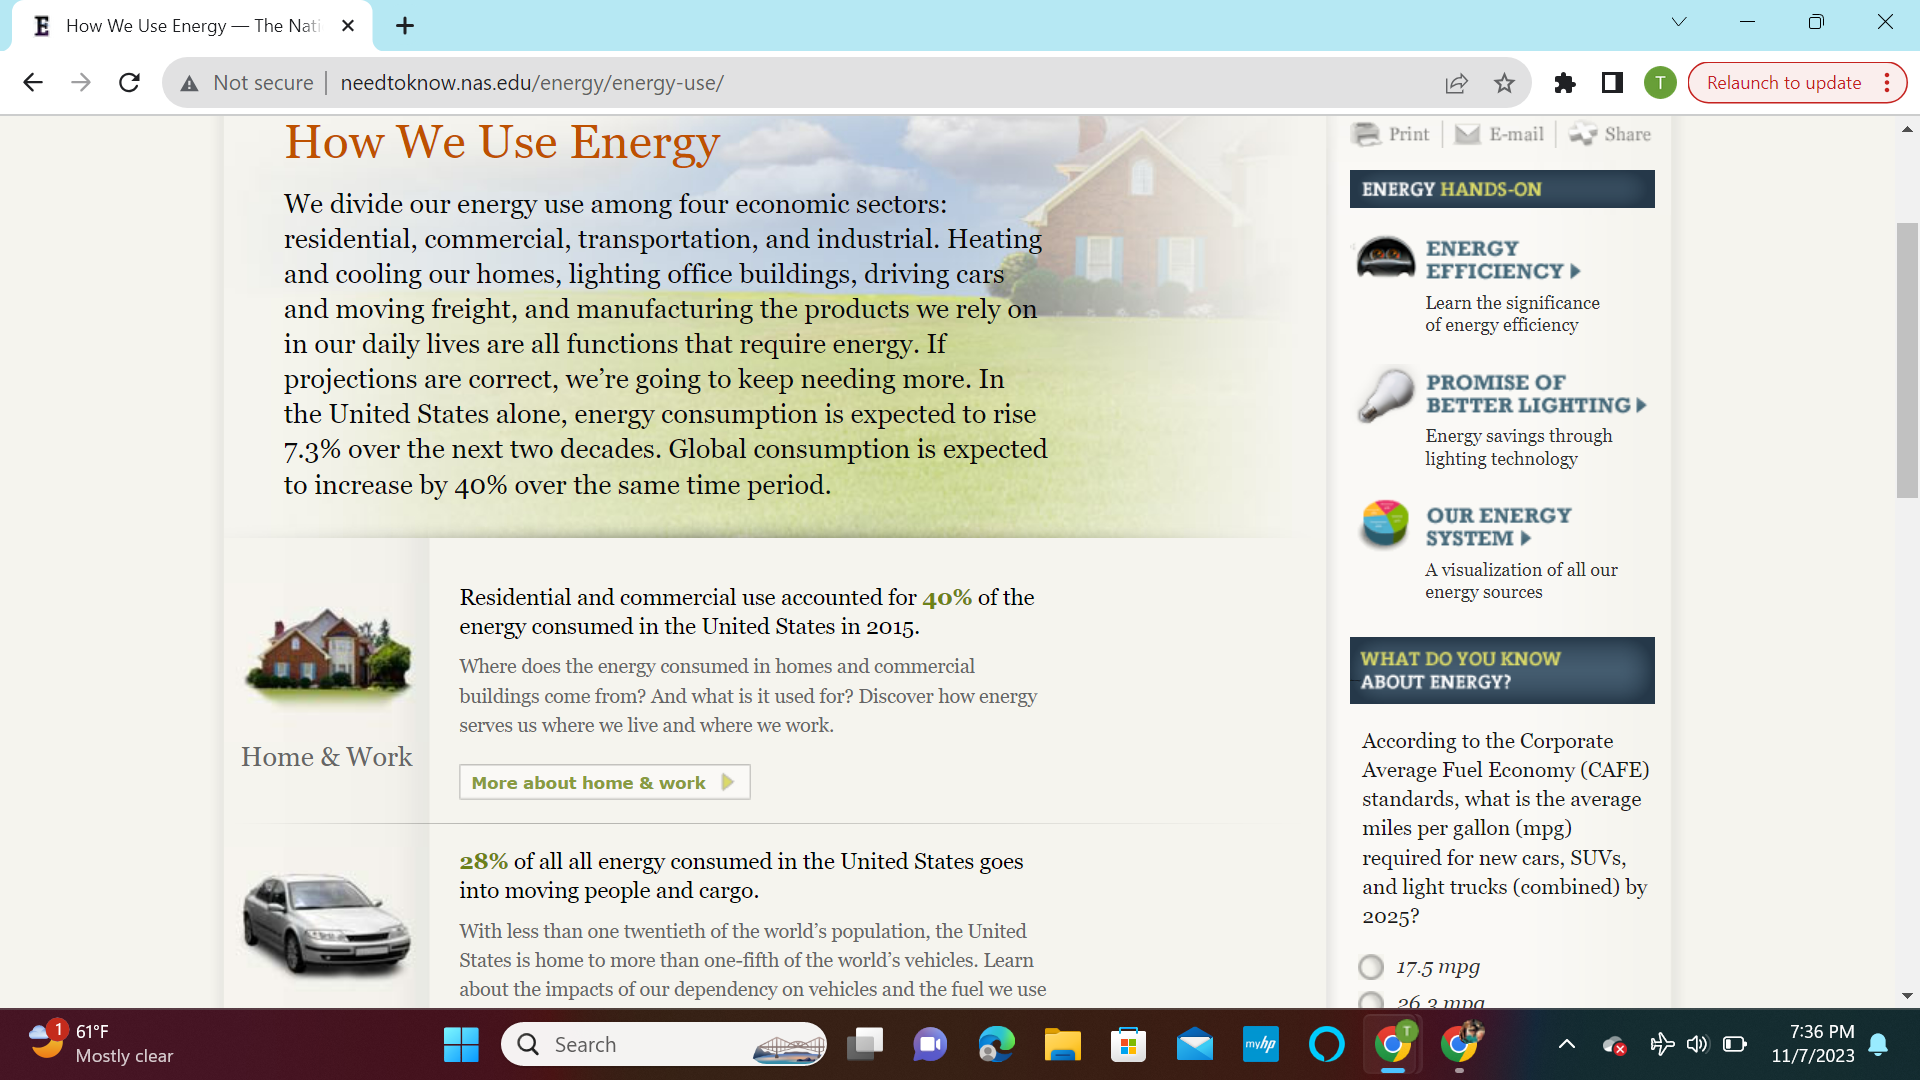
This website/article it highlights the intricate nature of the energy system in the United States, which involves a complex web of primary energy sources supplying energy to residential, commercial, industrial, and transportation sectors. Electricity, generated from various sources, distributes energy to these sectors. However, a significant portion of the energy supplied is lost as waste heat or inefficiencies. The United States’ energy consumption is projected to rise, and globally, energy demand is expected to increase substantially in the coming decades.
In how we use energy, it discusses the diverse mix of energy sources, including fossil fuels, nuclear power, and renewables, which contribute to the energy supply. It emphasizes the importance of understanding and visualizing this energy flow. Sankey diagrams can serve as powerful tools to represent this complexity, showcasing the sources and sectors involved, the environmental impact of different sources, and the importance of energy efficiency. Such visualizations can aid in informed decision-making about energy policy, sustainability, and the future of energy production and consumption in the United States and globally.
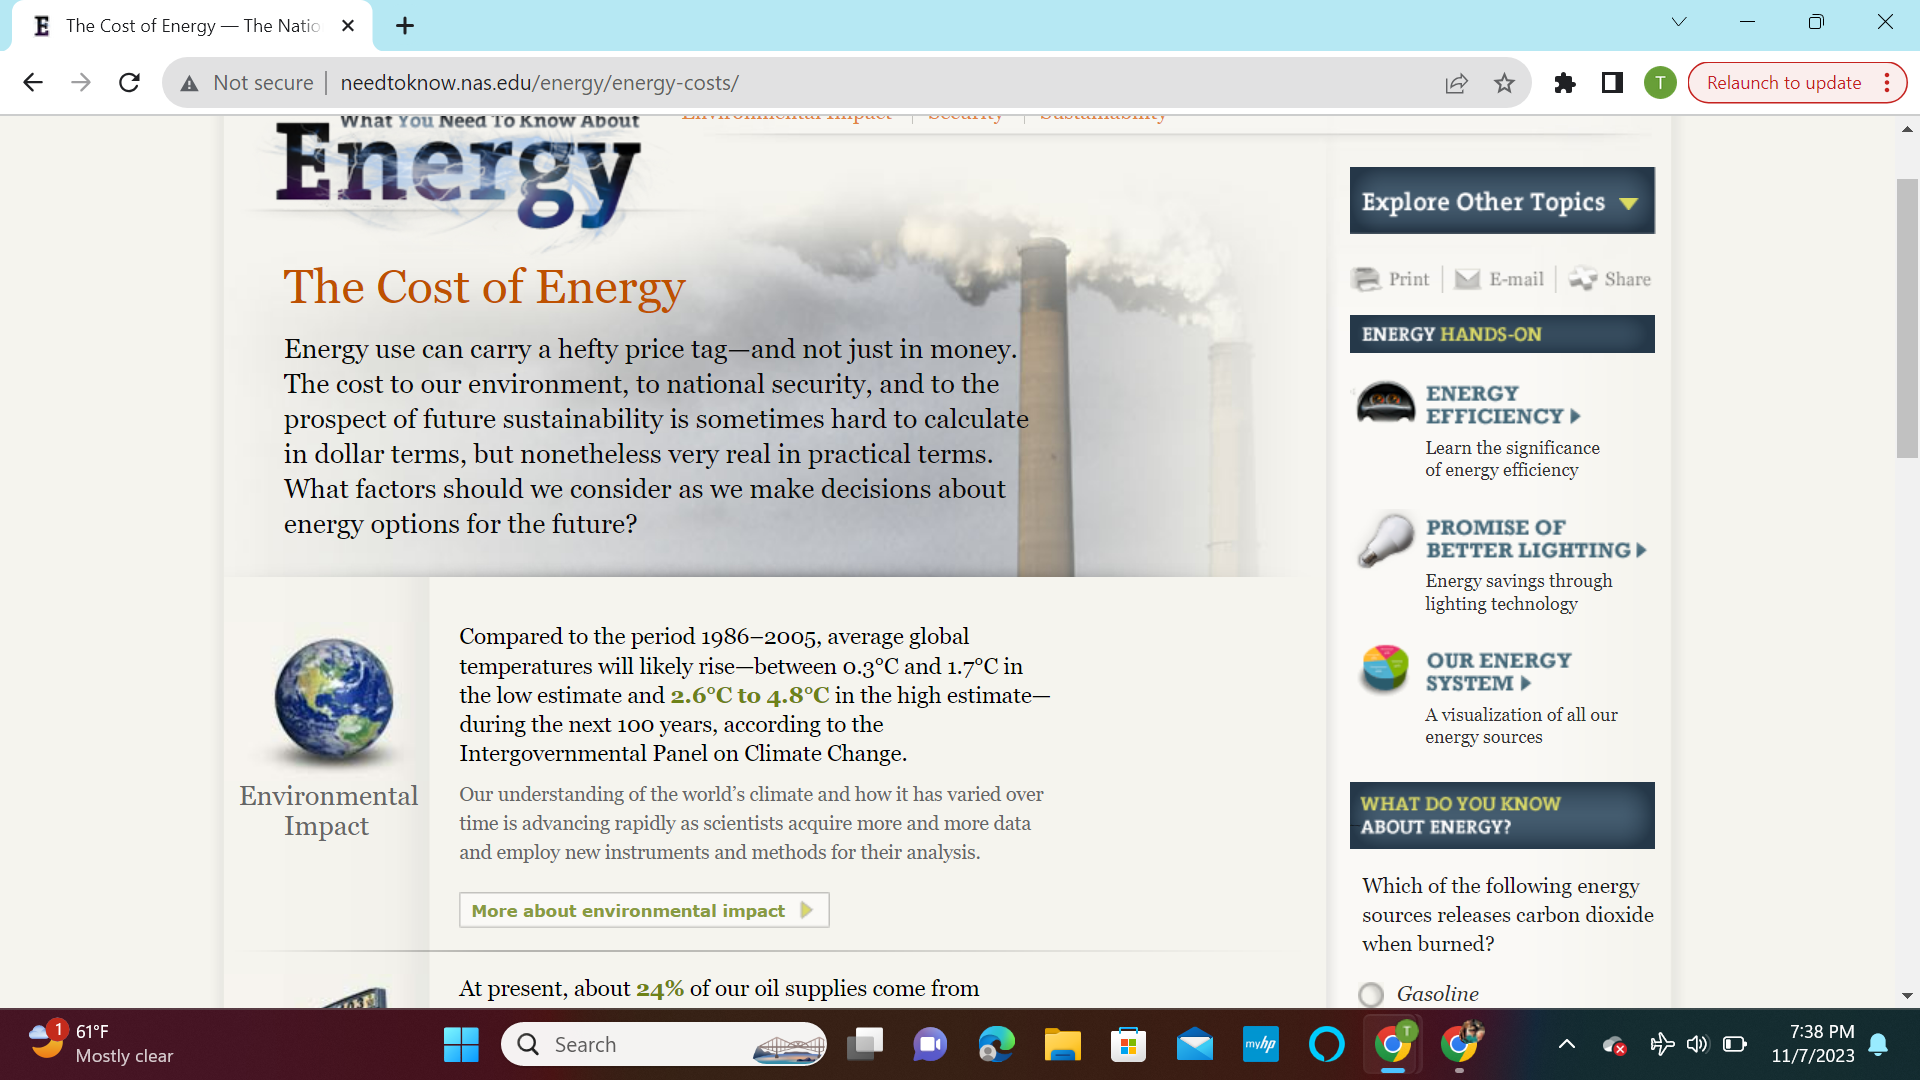
The comprehensive costs associated with energy use, extending beyond monetary expenses. It emphasizes that when making decisions about future energy options, it’s essential to consider environmental impact, national security, and sustainability factors. The text highlights the potential rise in global temperatures due to human-driven greenhouse gas emissions, the need to better understand and address climate change, and the risks associated with an energy supply heavily reliant on foreign sources. Additionally, it raises concerns about the unsustainable consumption of fossil fuels and emphasizes the imperative of accelerating the development and adoption of renewable energy sources for a more sustainable and secure energy future. In essence, it calls for a holistic and forward-thinking approach to energy decision-making that takes into account these critical factors.
All of the graphs were fun to play around with, but easily confusable. In the graphs, I liked how you could click individual parts and let you understand a little bit more about how it works. All in all I liked how the article came out.
Pie Charts
A perfect use case for a pie chart that I could think of right of my head is one for a academic performance breakdown. This type of chart is good to use for if you are an educator, and you want to provide a clear visualization of how students in a class have performed on their recent final exam, other assignments, and overall grade. It can the class’s collective progress. Additionally, it helps in identifying trends in academic performance over time, highlighting areas of strength and areas that may require additional attention within the classroom. Furthermore, this chart aids in fostering a transparent and data-driven approach to education, making it an essential resource for educators dedicated to enhancing their teaching methodologies and student outcomes.
If a professor takes a 100 of there students and compairs all there grades it would look like this, ( I used a random number generater for students grades on a exam)
When you look at the resulting pie chart, you can quickly see the distribution of student grades in the class. In this case:
- The largest slice of the pie represents the “C” grade, indicating that 34% of students achieved this grade.
- The “B” and “A” categories follow, with 13% and 8% of students.
- The “D” and “F” categories follow, with 17% and 28% of students.
Usefulness:
- Communication: This pie chart is a powerful communication tool, especially during parent-teacher conferences or academic meetings, to visually and intuitively convey the distribution of student performance.
- Decision-Making: Educators and administrators can use this chart to assess the effectiveness of teaching methods or the difficulty of the exam. If a significant portion of students received a low grade, it may trigger a review of the curriculum.
- Goal Setting: Students can use this chart to set goals for improvement. If a student received a “C” and wants to aim for an “A,” they can see that they are in the 34% of students who achieved that grade.
- Motivation: It can also motivate students to see the distribution and strive to achieve higher grades, as they can visually see their progress relative to their peers.
Now, a teacher can look at this chart and quickly see that their students are struggling to understand the material. This may prompt them to change how they teach to help students learn better.
sources
https://ourworldindata.org/global-education
https://www.researchgate.net/figure/The-Chart-of-the-Students-Performance-Result_fig1_283696801
https://educlimber.illuminateed.com/hc/en-us/articles/1260802416249-Understanding-Academic-Charts
Lollipop Chart
Lollipop charts are flexible tools for comparing data, ranking items, showing distributions, tracking changes, and highlighting outliers. They are great for revealing the order and values of data points. Lollipop charts work well when you want to focus on individual data points or unusual values, serving as a handy alternative to regular bar charts with clear data labels. Lollipop charts should be used when you want to emphasize individual data points or highlight specific values in a clear and simple manner, they are especially effective for showing comparisons between a small number of data points.
Here are some other examples of charts –
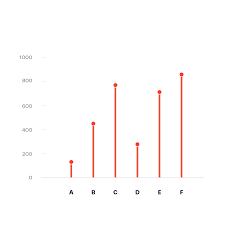

For the lollipop chart I constructed, I choose to use excell since its the eastest and most effectice tool I know how to access and use. For the data set I used a website called https://generatedata.com/, this is where I can get all my random data sets from.

Benchmark Comparisons
Some different ways people can show comparisons to a benchmark is through competitive, strategic, & performance. Competitive benchmarking is emphasized as the most effective form of benchmarking for businesses, allowing them to assess their true success by comparing themselves to competitors. It provides insights into industry trends and competitor strategies. To perform competitive benchmarking effectively, companies should establish clear goals and parameters and leverage digital tools for in-depth analysis, going beyond basic benchmarks like revenue and growth to gain a granular view of competitors’ data for more informed decision-making. Strategic benchmarking focuses on learning from industry leaders and best-in-class companies to understand their success and identify areas for improvement in your own business. It involves analyzing their business models and strategies to optimize various aspects of your own organization, such as marketing, online presence, or finances. Mobile app intelligence tools like Similarweb are highlighted as essential for gaining insights into mobile app trends and competitors’ strategies. Performance benchmarking aims to compare profitability and establish ambitious but achievable goals based on quantitative data comparisons, focusing on performance indicators like price, quality, speed, and reliability, ultimately driving continuous improvement.
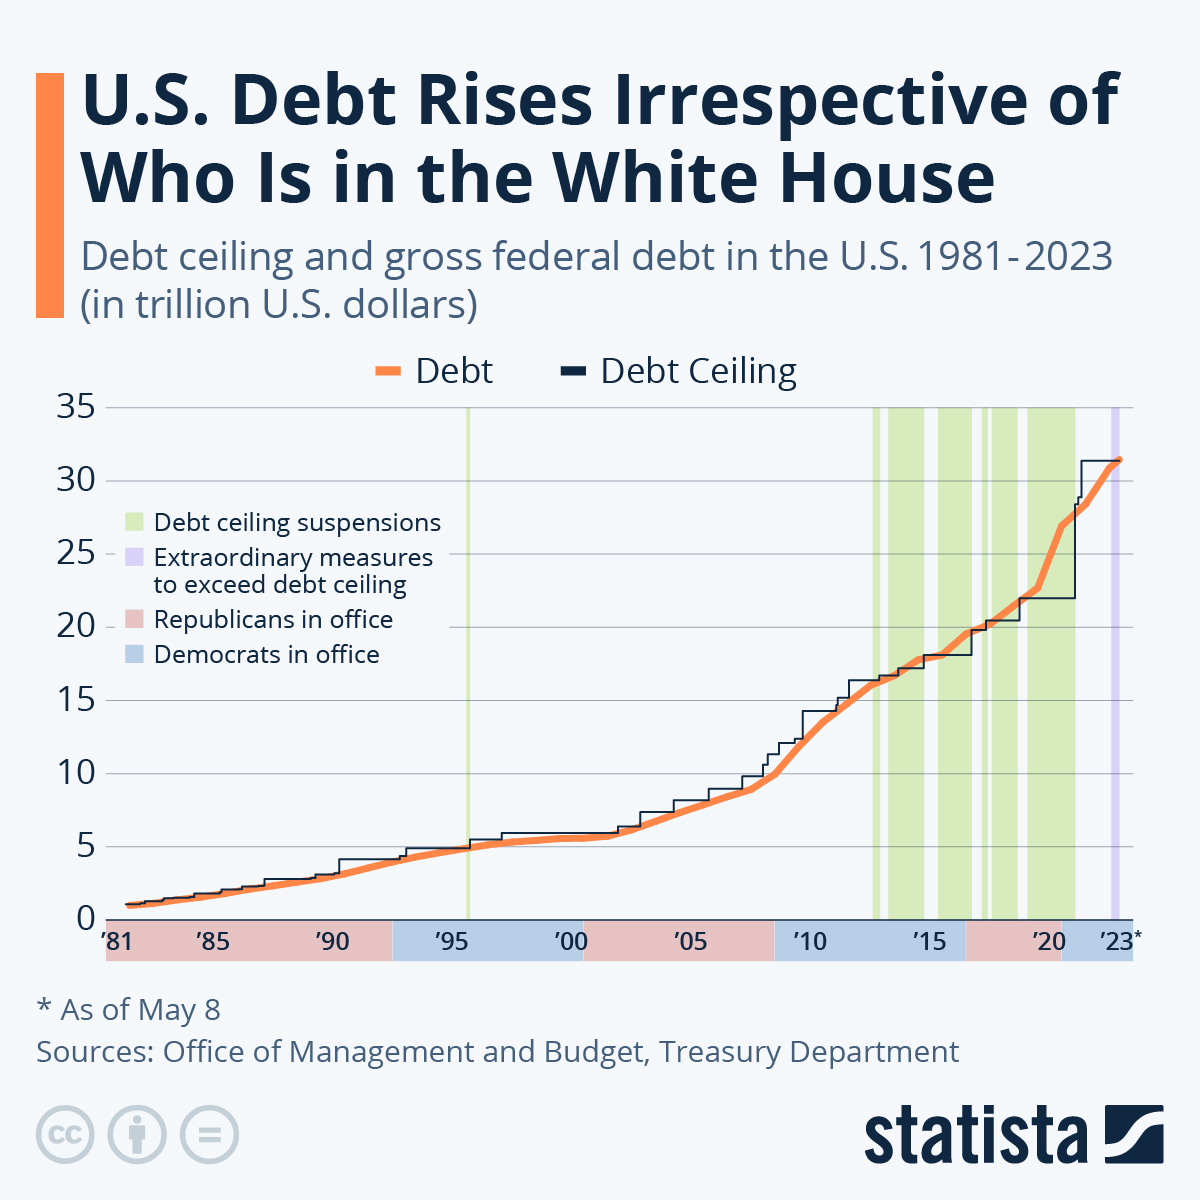
is this graph of the “U.S. Debt Rises Irrespective of Who Is in the White House” the benchmark is the debt. In this graph the numbers highlighted in blue at the bottom represent Democrats in office and red represents Republican. In this graph it shows typically it doesnt matter which group is in office because the debt rises no matter what.
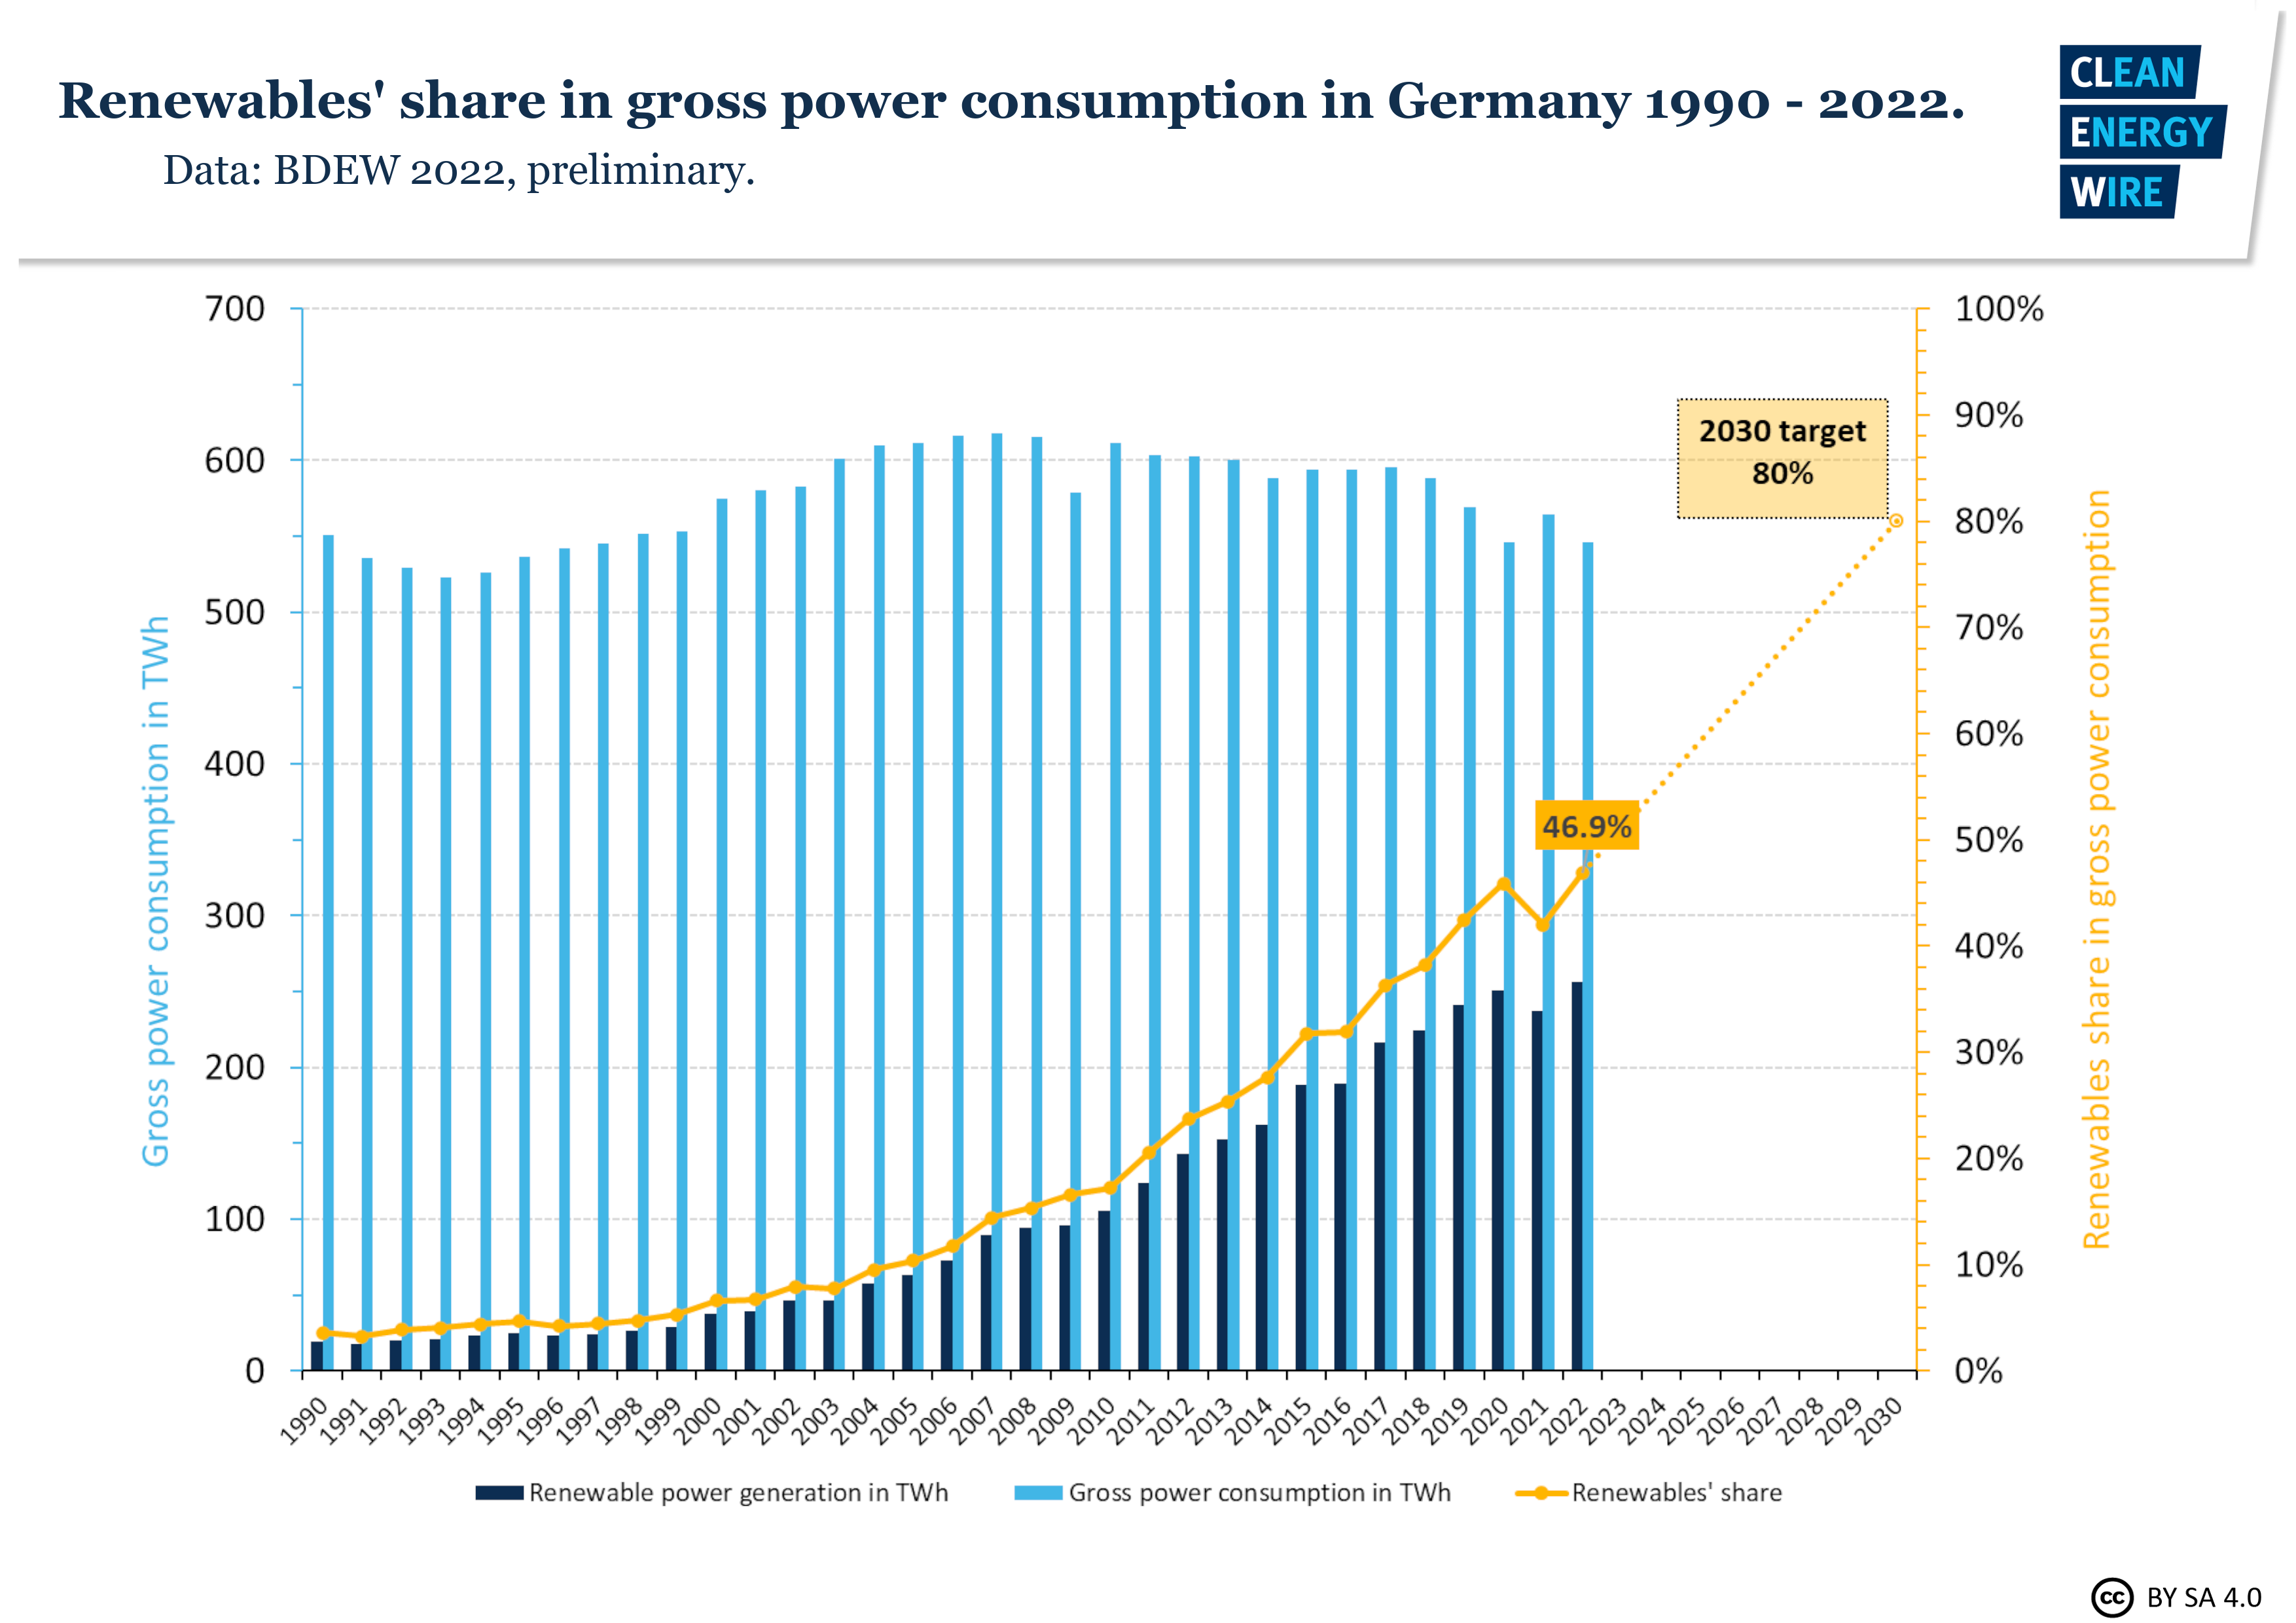
In this graph it shows Germanys power consumption throughout the years. The benchmark line is the yellow line indicating renewable shares. Germany is predicting that it will raise from 50% to 80% in the next 10 years.
sources
https://www.statista.com/chart/1505/americas-debt-ceiling-dilemma/
Comparing Numbers
Tools that may help us construct visualizations that compare numbers.
Before researching the tools that help us construct visualizations that compare numbers, through this class, it was primarily about infographics or, more importantly, different types of charts. Charts help us by visually representing data, making complex information more accessible and understandable.These visual representations, such as bar graphs, line charts, and scatter plots, enable us to identify trends, patterns, and outliers in datasets effortlessly. They serve as powerful tools for conveying insights and supporting data-driven decision-making processes. Exploring the various chart types and their applications has been a fundamental part of our journey in mastering data visualization.

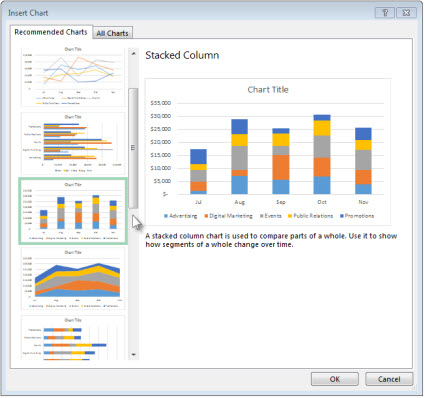
Through researching and this class, excell is the easiest and most effective tool in hrlping onstruct visualizations that compare numbers. Excel helps construct visualizations that compare numbers by offering a user-friendly Chart Wizard, data sorting and filtering capabilities, customization options, and interactive features. It also provides the flexibility to work with various data sources and create professional-looking charts and graphs, making it a versatile tool for data analysis and presentation.
Some cool things about Excel include its comprehensive help options, allowing users to type in queries and receive relevant results. Additionally, the abundance of online resources, forums, and tutorial videos makes it easy to find solutions to any difficulties you may encounter while using Excel for data visualization, benefiting from its widespread popularity. Also, Excel’s consistent updates and improvements ensure that users have access to the latest features and functionalities, enhancing their capabilities for creating even more dynamic and insightful visualizations for comparing numbers.
sources
Vizhealth
I truly believe that including visualizations in an event improves its relatability by enabling people to see it take place in front of their very eyes. Take the blood pressure visualization as an example, where viewing the actual numerical values expressed as percentages makes them more relatable and understandable. Having a concrete object of focus makes it easier for people to understand and integrate difficult topics by giving them a visual depiction.
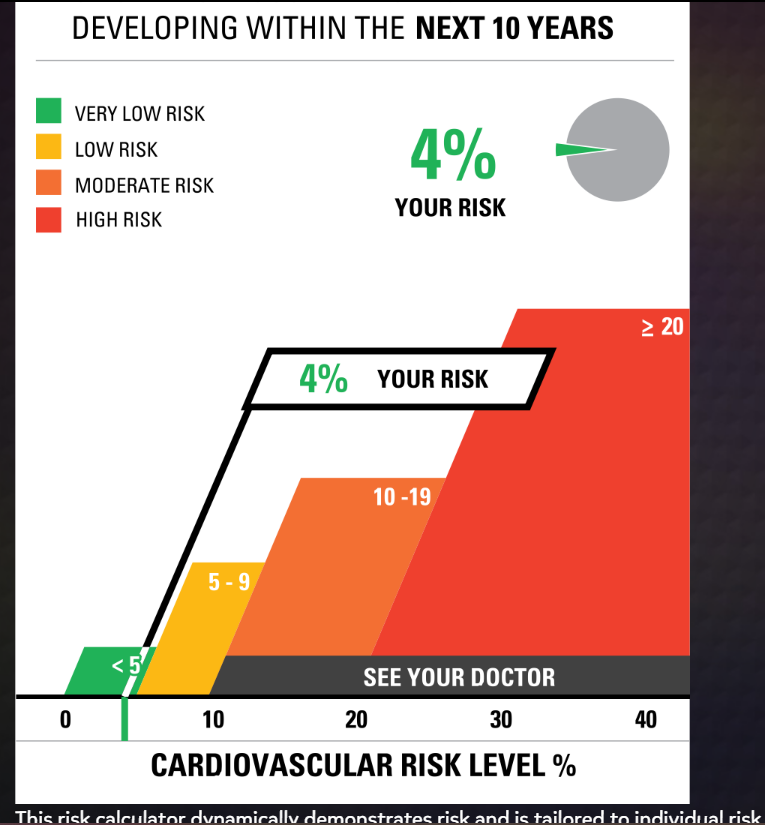
For the first chart, I used my mother’s real doctor cholesterol data. She agreed with the correctness of the final data visualization, demonstrating the validity of the visualization tool.
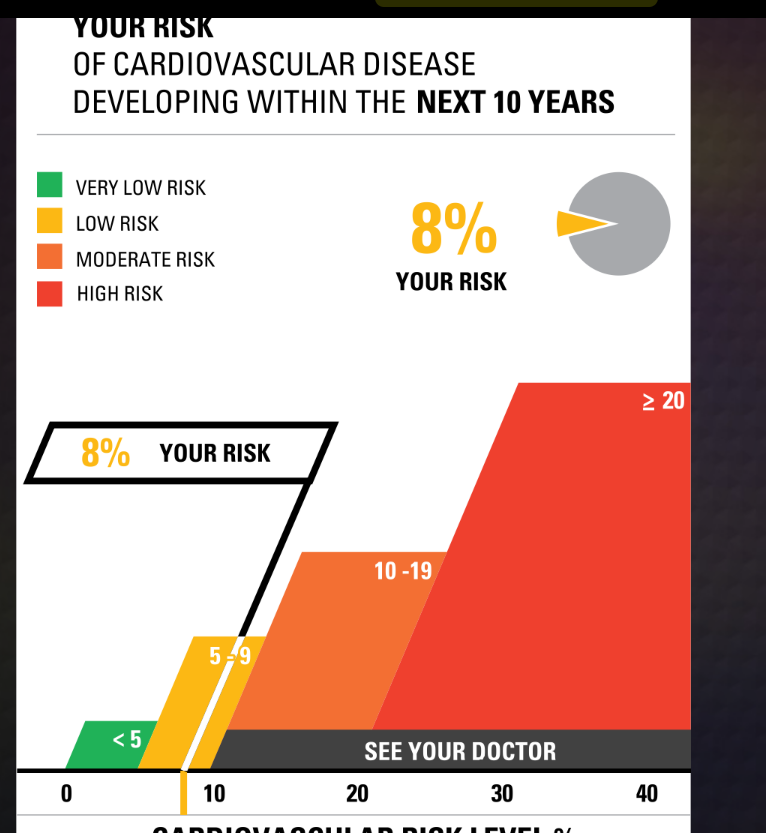
For the second one, I raised the numbers in every bar a little bit higher and checked yes for smoking and dietbites. I was shocked to find that it only went up 4 points. I was expecting a lot more.
The Icon Array Generator was an instrestiing graph. I played aroudn with this for a little bit and made my own on hair data
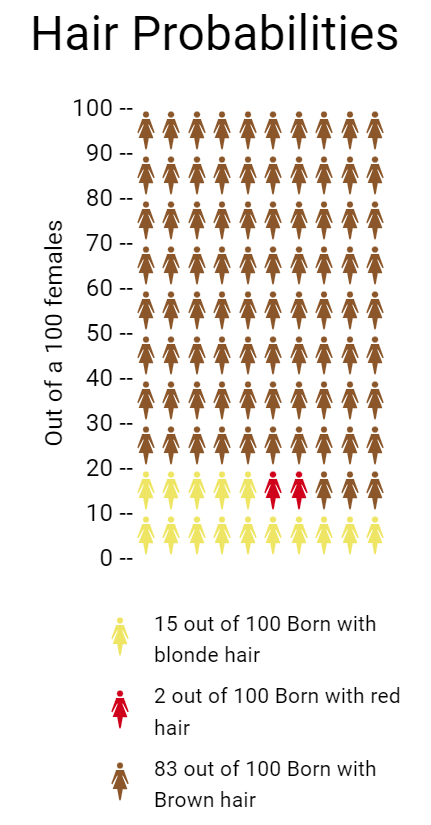
- Blonde Hair: Approximately 10–15 people out of 100 may have blonde hair. This is a very general estimate.
- Brown Hair: The majority of the global population has brown hair, so a significant proportion, around 70–80 people out of 100, may have brown hair
- Red Hair: Red hair is relatively rare, and only around 1–2% of the world’s population has red hair. So, roughly 1-2 people out of 100 may have red hair
per https://www.eupedia.com/genetics/origins_of_red_hair.shtml
Tools that may help us construct Infographics
There are many tools and websites that can help you construct an infographic with one easy search on Google. From my quick research, I found that the easiest websites to navigate (not the best) and create an infographic are Canva, Adobe Express, and Infogram. Canva is known for its user-friendly, intuitive interface that makes it usable by users with different degrees of design ability. To produce infographics with a professional appearance, you are not required to be a graphic designer. Infographic templates in a variety of designs, topics, and uses are available from Canva. These pre-designed, eye-catching templates can help you get going quickly. You can pick a template based on the type of content and presentation you prefer. Adobe Express makes it so have precise control over the design of your infographic, it enables you to generate scalable visuals and icons, utilize a variety of drawing tools, and work with layers. Infogram makes it easier to create infographics by providing a user-friendly interface, pre-designed templates, and data visualization tools, enabling users to quickly create informative and aesthetically pleasing infographics.
Sources : https://www.practicalecommerce.com/tools-for-creating-infographics
- https://www.unboxsocial.com/blog/tools-to-create-engaging-infographics/
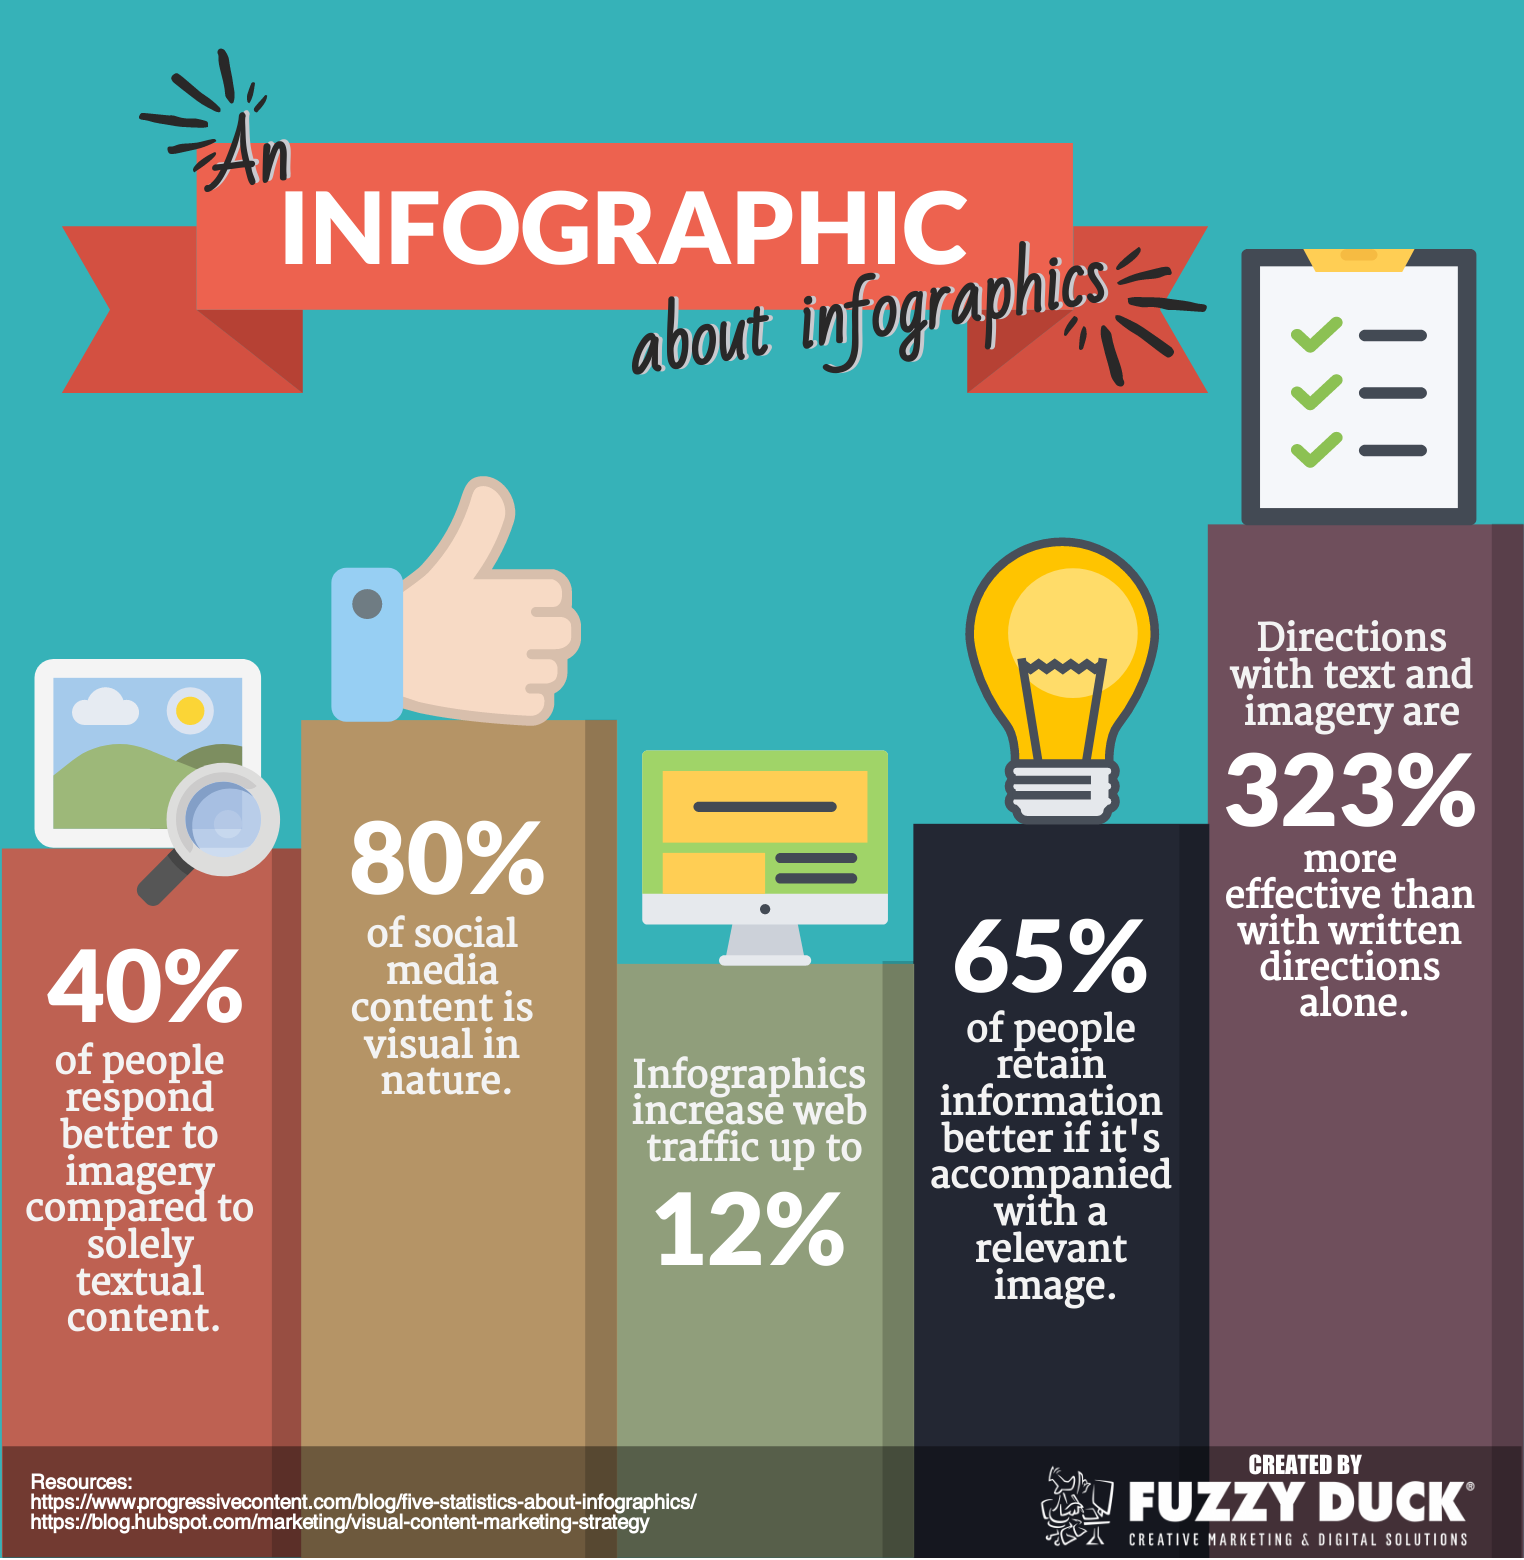
- https://shrutideshpande.co.uk/why-infographics-are-important-to-your-content-marketing/