A pivot table is an extremely useful and powerful feature in Excel. It allows you to extract the significant information from a large, detailed data set. When you have a very large data set it is hard to see any trends or come to conclusions about the data. With a couple clicks, pivot tables can help readers better understand the data by summarizing it and showcasing the important information.
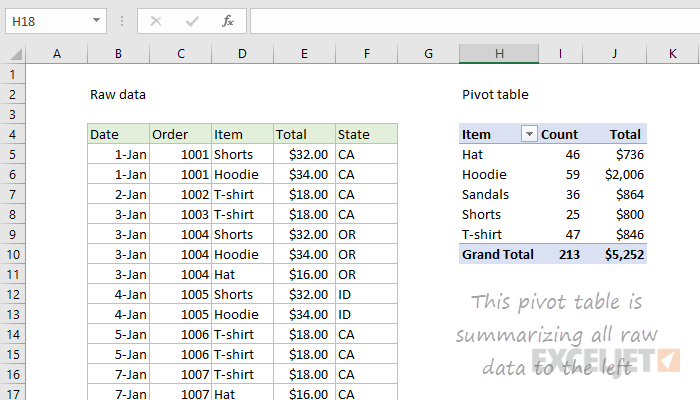
On the left is a raw data set of clothes sales. It includes the date of the sale, order number, item type, total cost, and state of purchase. The sheet extends for many rows and gets super overwhelming. The pivot table of the data is shown on the right. This organized the data and sorted it by the item of clothing. It then tallied up how much of each item was sold and also presented the total sales from each item. This is way easier to read and helps show trends and important information. You can see that hoodies were sold the most with 59 of them, and they also made the most money with $2,006. You can also see a total of 213 items were sold for $5,252. In conclusion, pivot tables are a great way to summarize a lot of information very quickly and easily.