Pivot tables are a great tool to use when able to summarize, analyze, explore, and present summary data.
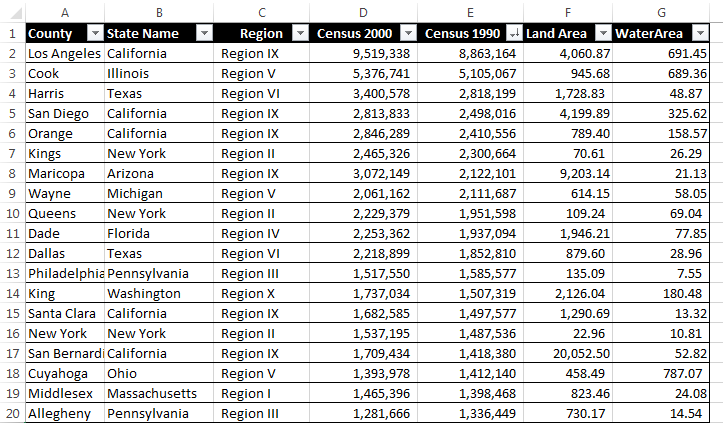
Here is an example that compares the data of 19 different state county’s based on region, two different census years and water/land area. Besides what is shown in this one image there are many different things one can do with pivot tables to express their data. Some examples include averaging, grouping by date, directional icons, and percentage of row total.
More things that can be done with pivot table can be found here.