What is a pivot table?
“A pivot table is a statistics tool that summarizes and reorganizes selected columns and rows of data in a spreadsheet or database table to obtain a desired report. The tool does not actually change the spreadsheet or database itself, it simply “pivots” or turns the data to view it from different perspectives.”
Example:
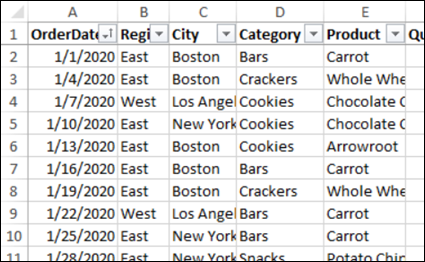
This here is an example of data that deals with food sales. This is much less than half of the data, it goes on to 244 rows. There are columns and one is filled with calculations.
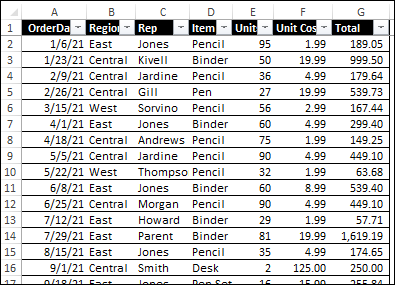
Here is another example. This one has 10 columns and 500 rows. These columns do not have calculations, but the rows have data on insurance policy.
Citations:
Debra, A. (2020, November 12). Excel sample data for pivot table testing. Excel Pivot Tables. Retrieved from https://www.pivot-table.com/2020/11/04/excel-sample-data-for-pivot-table-testing/
Lewis, S. (2019, August 8). What is a pivot table? definition from whatis.com. Data Management. Retrieved from https://www.techtarget.com/searchdatamanagement/definition/pivot-table