Created by: Victoria Valenzuela
What Is a Pivot Table?
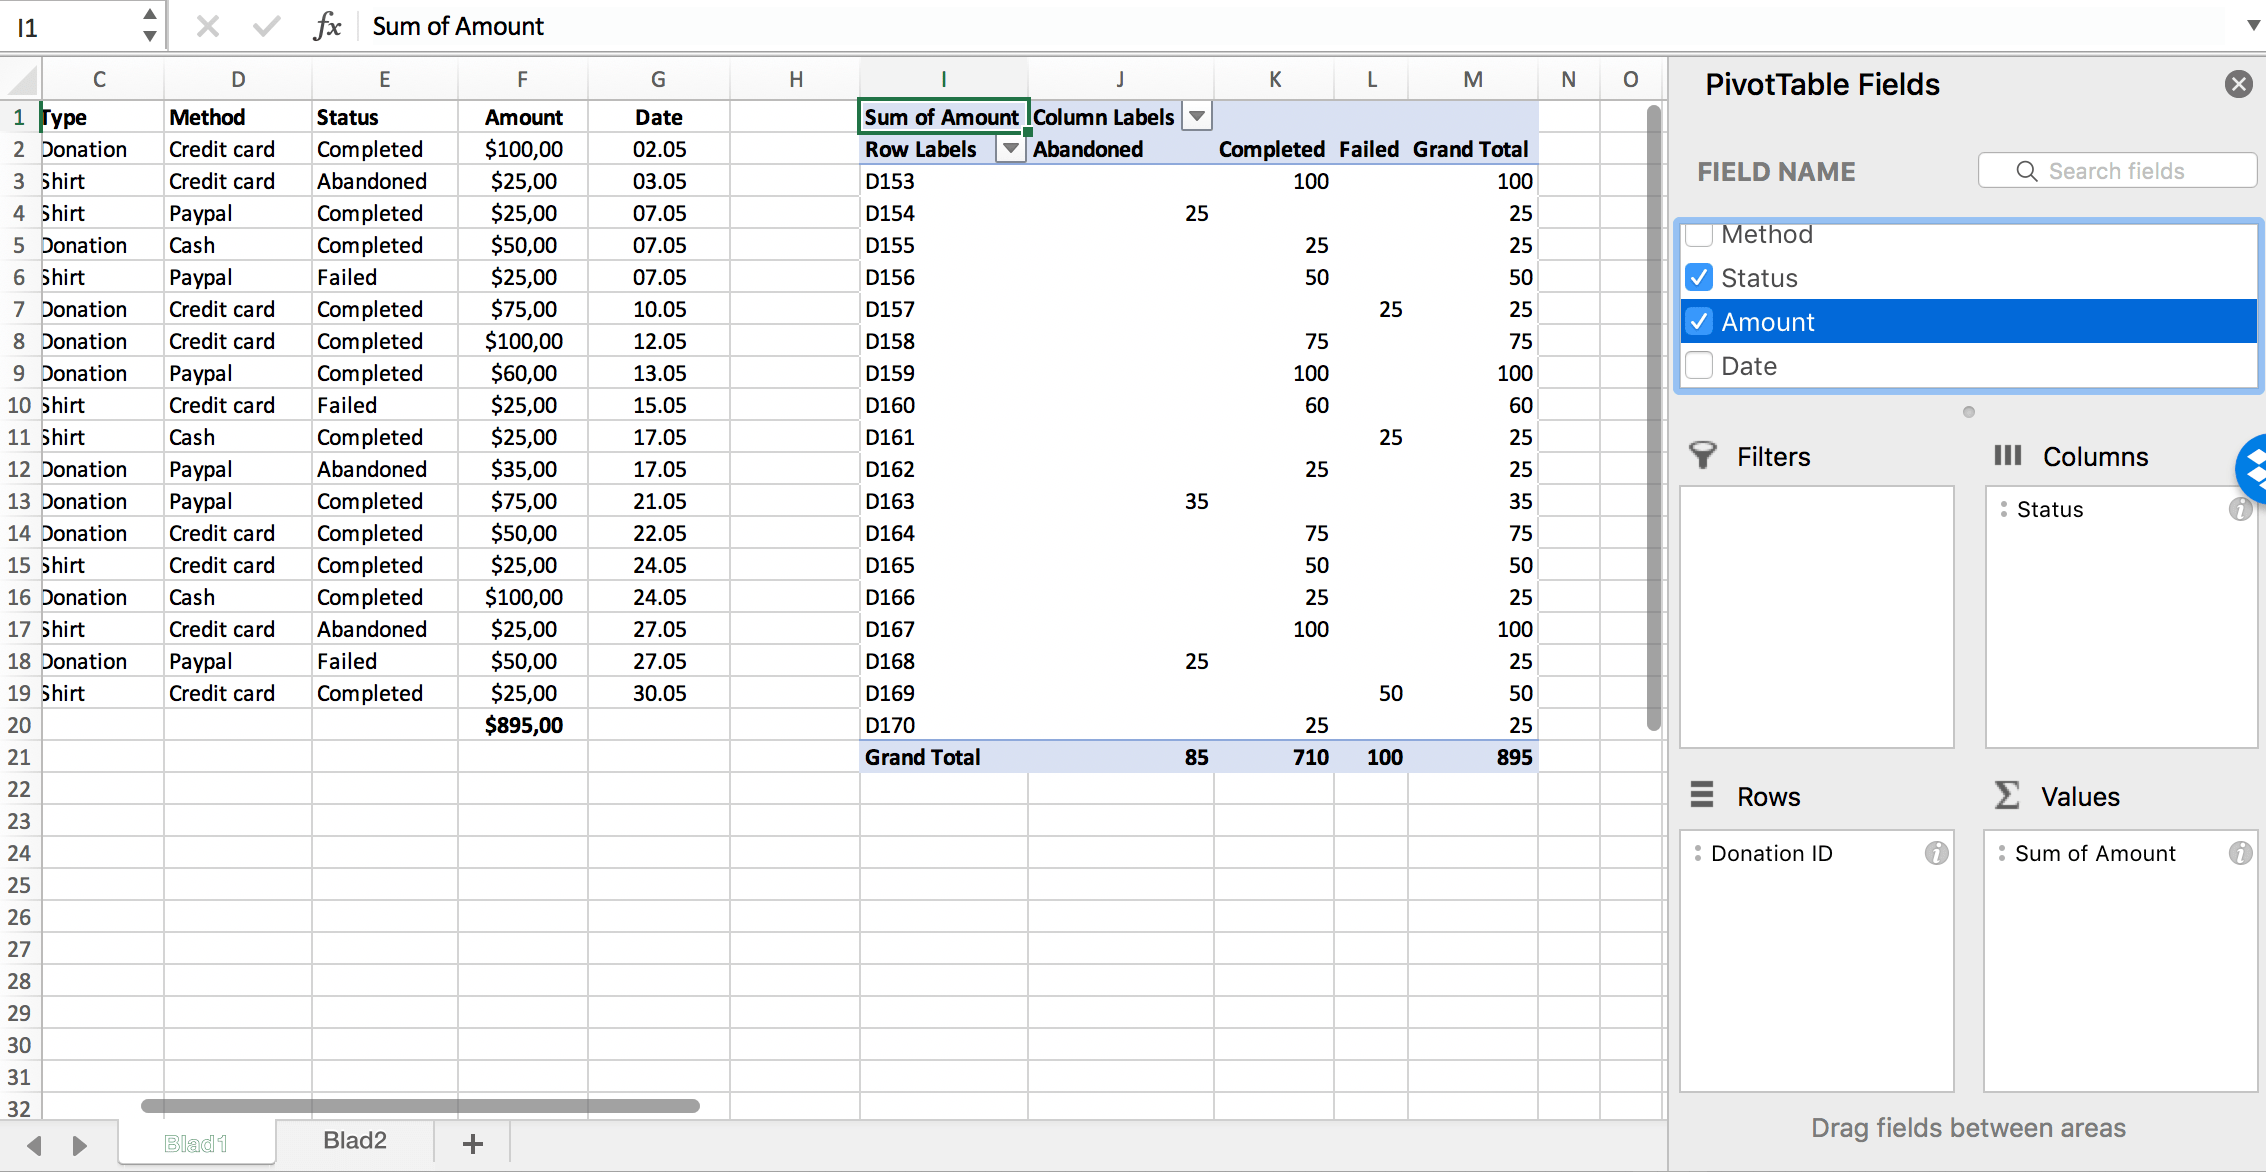
Pivot Tables are used to calculate and analyze data. It allows you to see a change in your data with trends, patterns, and comparisons. They are super helpful especially when you have a large data set. You can categorize your set to differentiate one data from the other.
How can you use a Pivot Table?
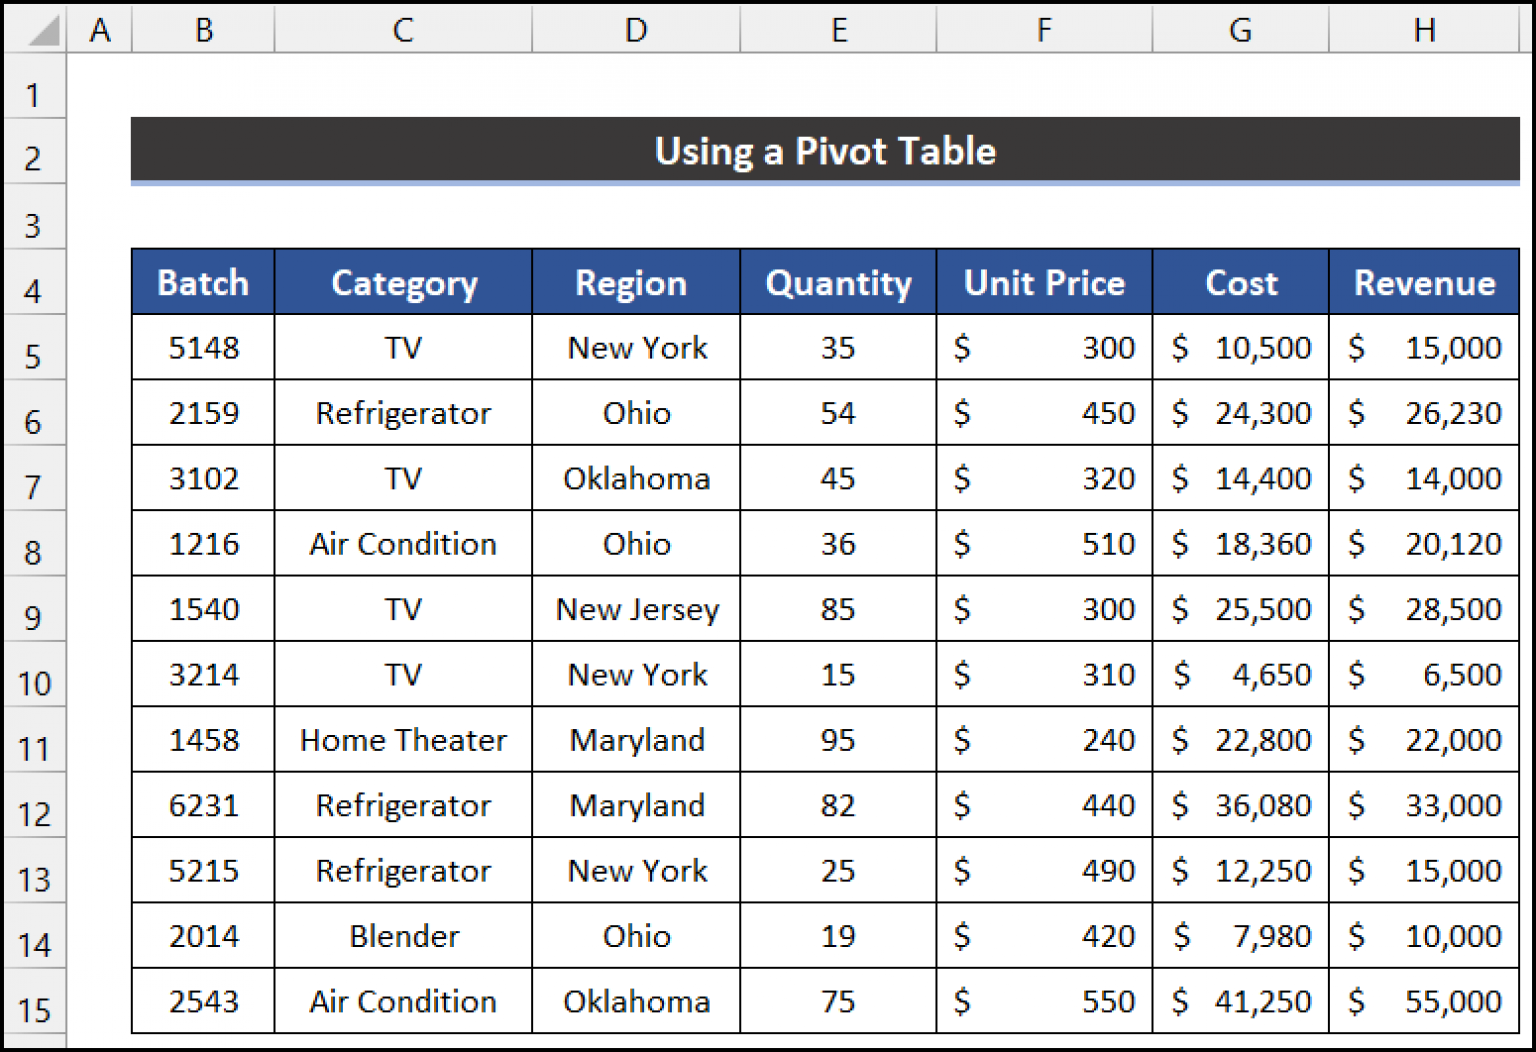
This particular pivot table includes a data set describing batches of home items. The data shows separation between the price, quantity, region, etc. The link posted shows exactly how to create a pivot table on Excel.
Why Is It Helpful?
Pivot Tables are helpful because they allow users to understand their data, have it organized into one block, and manage all of the numbers. You can clearly see all of your data split into rows and columns correlating to which it relates to. This will answer many questions any professor or outsider will have while analyzing your data set.