Pivot Tables are a highly useful interactive way to quickly summarize large amounts of data. It takes user-specified data fields and converts the headers into a data option that can be easily manipulated. Data can be summarized in numerous ways, including averages and frequencies. Lorman Education published an informative article about pivot tables. They describe 6 benefits of using a pivot table in Excel:
- Simplicity
- Data Analysis
- Data Summaries
- Pattern Recognition
- Quick Reports
- Decision Making
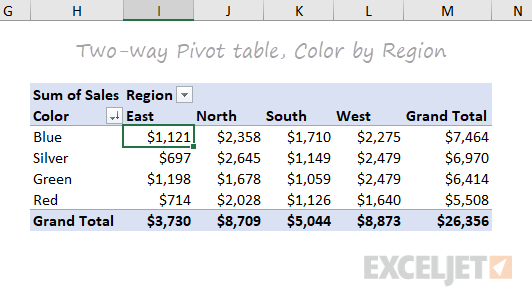
The image above is an example of a pivot table created by ExcelJet. It clearly demonstrates Sum of Sales by color in each region. Colors are sorted by row and regions are sorted by columns. The table also includes a total row according to each color and region, as well as a grand total.

This is another example of a pivot table created by ExcelJet using the same data, just with the rows and columns switched. There is a simple drag-and-drop method that can change the parameters of the table within seconds. ExcelJet also provides a few benefits of pivot tables:
- Simplicity
- Speed
- Flexibility
- Accuracy
- Formatting
- Updates
- Filtering
- Charts