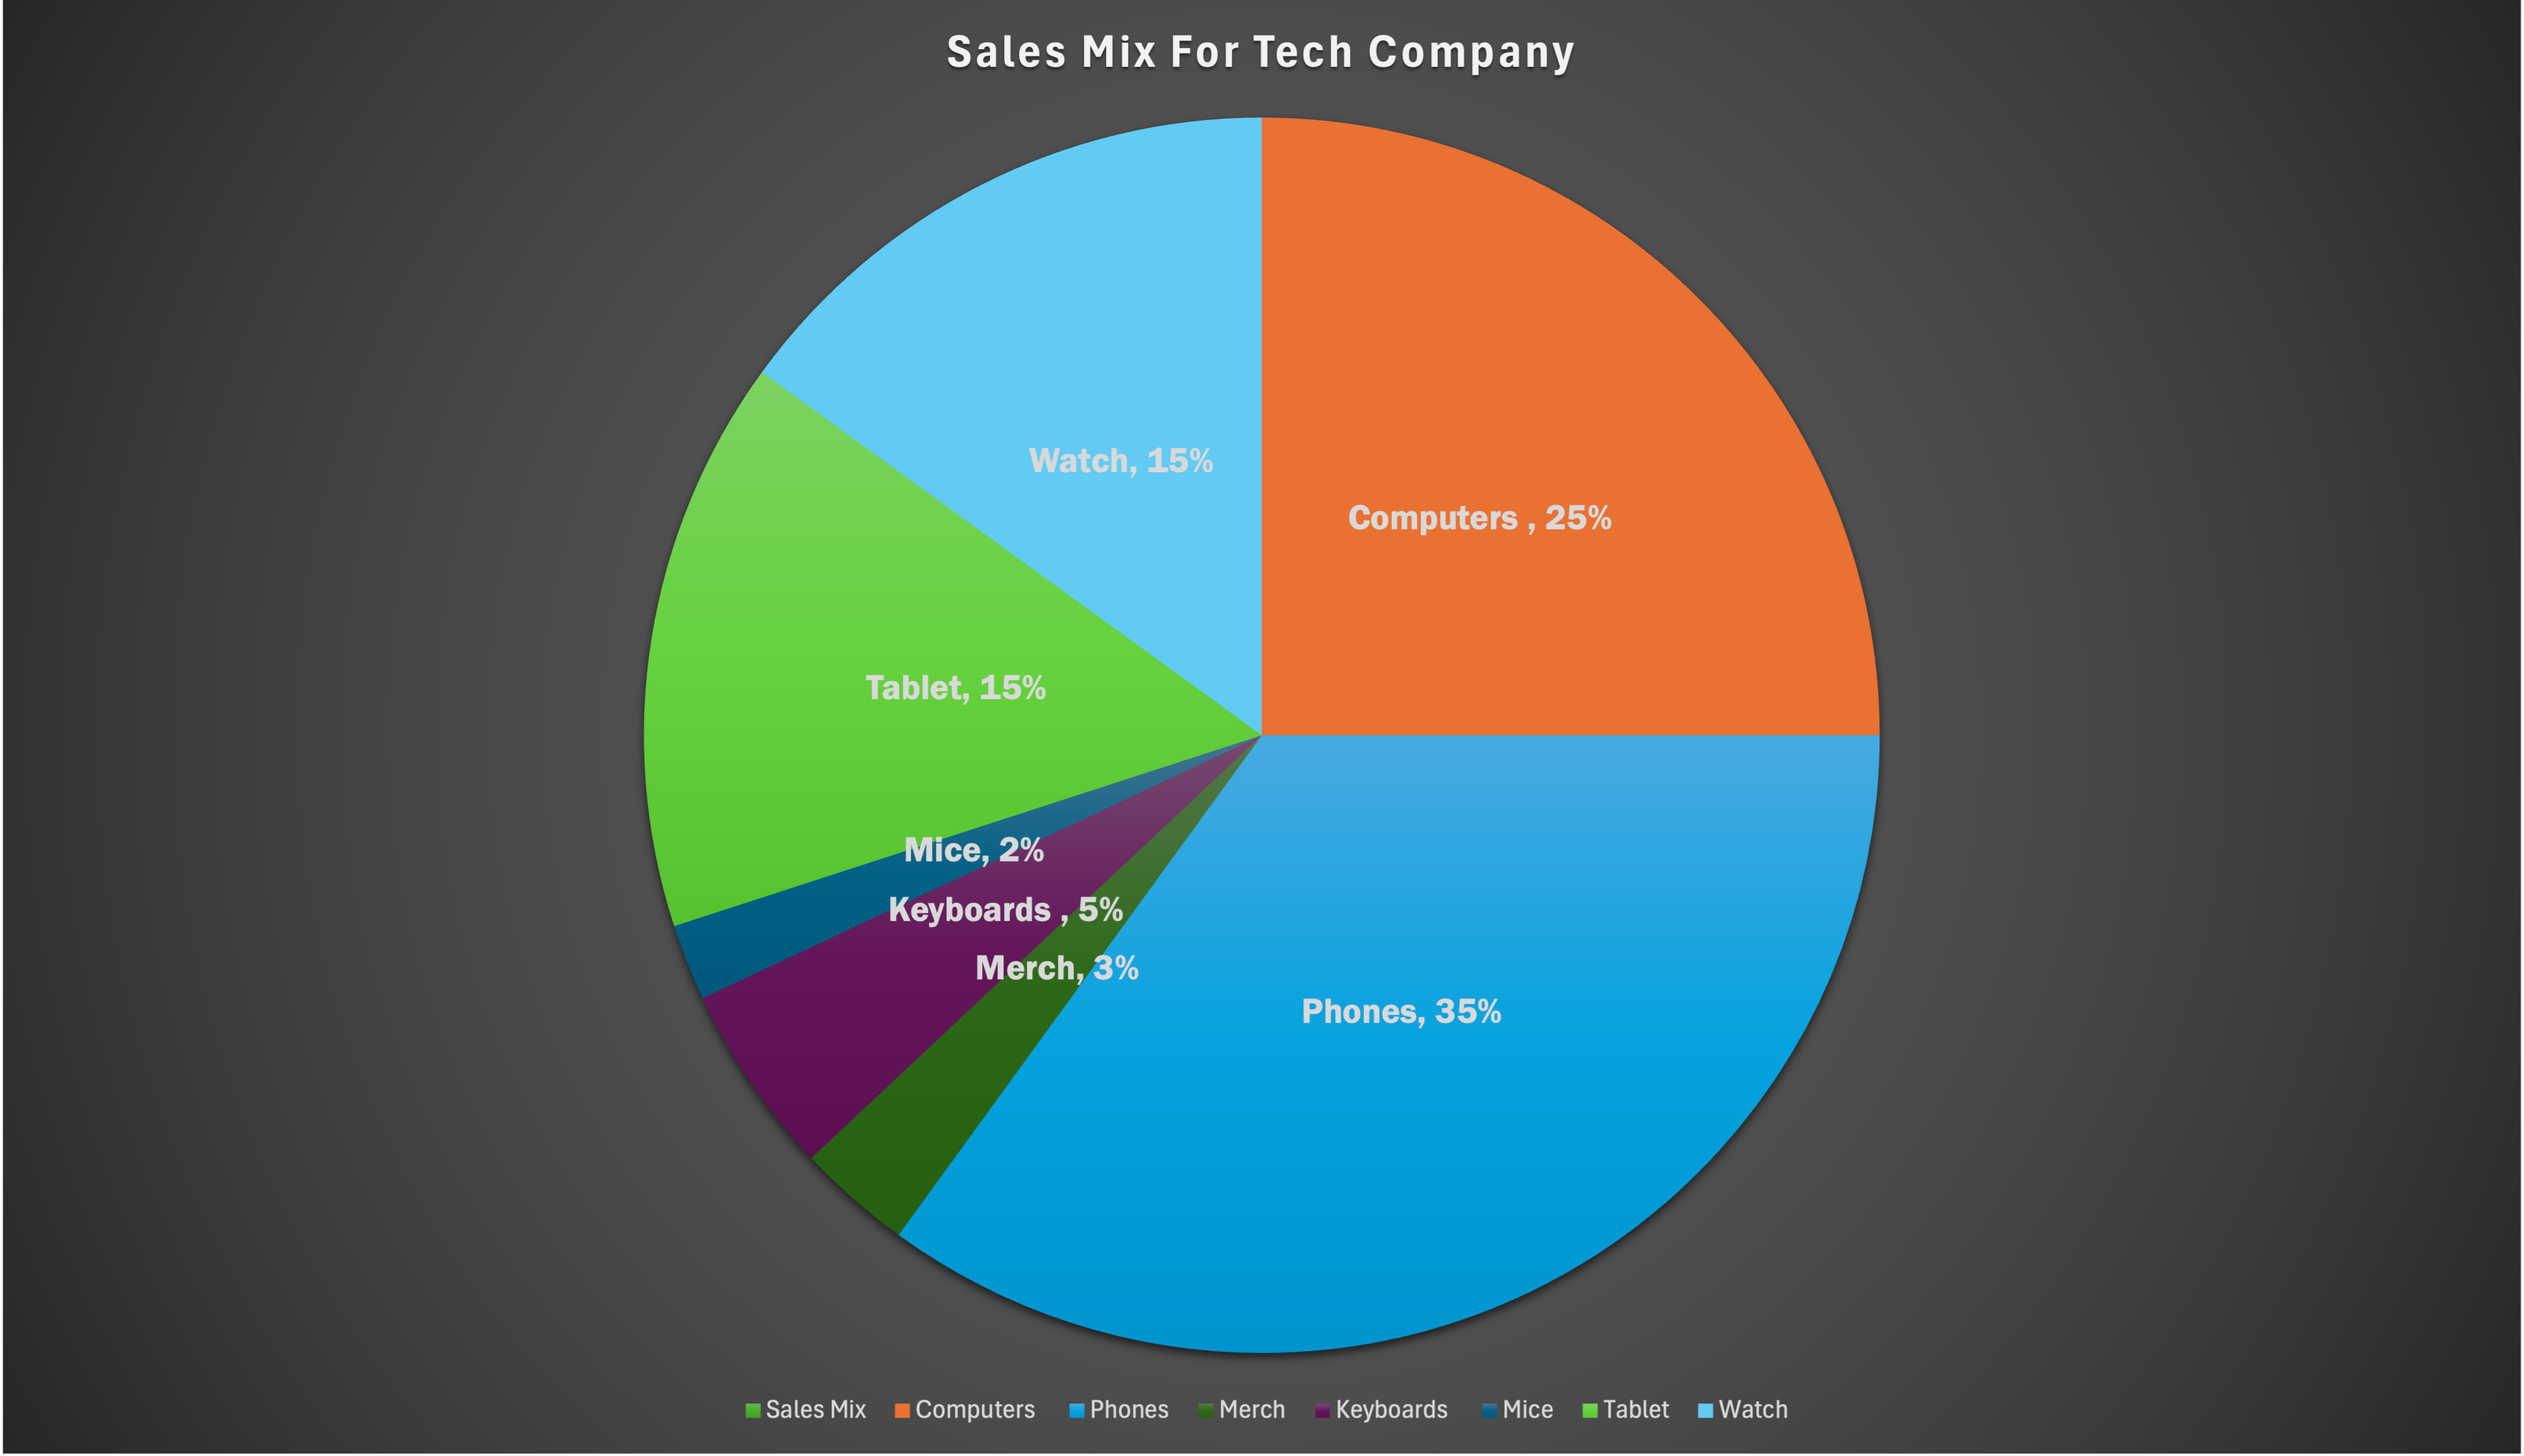
A perfect use case for a pie chart is total sales mix for a company. Pie charts are most useful when there is a part to whole relationship. When discussing the total sales mix for a company, each product sold for the company is a percentage of the total, 100%, of sales. For example, I made a pie chart for a fictional tech company whose sales mix are made up from computers, phones, tablets, watches, and so on. I made my chart in a way where you can efficiently differentiate the products from one another by using different colors and labeling them in the legend. I also added data labels and the percentage inside of the slice, for easy accessibility and to accurately show the percentage. Could you use other charts for this data? Yes! However, other charts would not be able to show the part to whole relationship as this pie chart. If you used a bar graph you could see the same data, but you would not be able to visualize that each part is made up of a total 100% of the companies sales mix. This is why using a pie chart for this data is so great!
