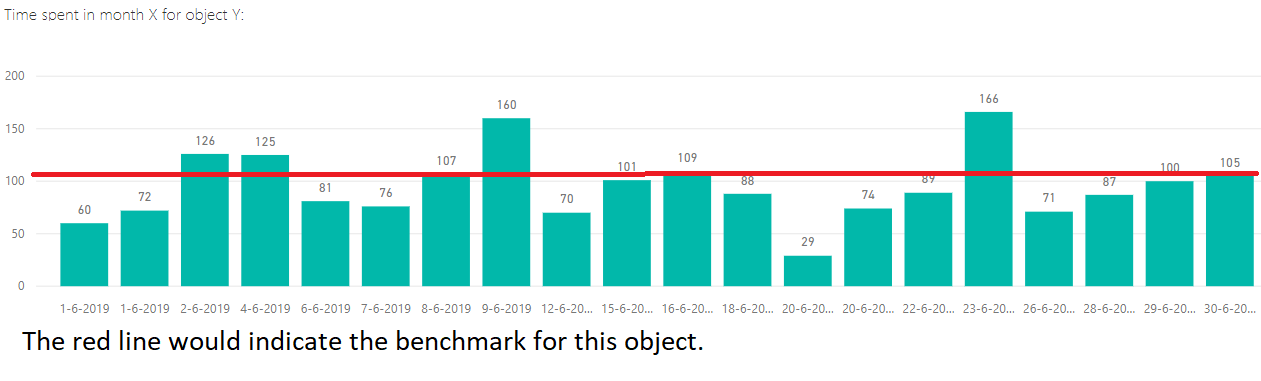
Data visualizations play a crucial role in how we interpret and understand information, especially when it comes to making comparisons against a benchmark. One common method is through the use of bar charts, which allow viewers to easily see the differences in values between various categories. For instance, if a company wants to compare its sales figures to industry standards, a bar chart can clearly illustrate how its performance stacks up against competitors. This visual representation makes it easier for people to grasp the data at a glance, highlighting areas of strength and weakness.
Another effective way to showcase comparisons is through line graphs, which are particularly useful for displaying trends over time. By plotting data points on a timeline, viewers can observe how a particular metric, such as revenue or customer satisfaction, changes in relation to a benchmark. This method not only provides a clear visual of the data but also allows for the identification of patterns, such as seasonal fluctuations or long-term growth. Line graphs can be especially powerful when comparing multiple datasets, as they can show how different entities perform relative to one another over the same period.

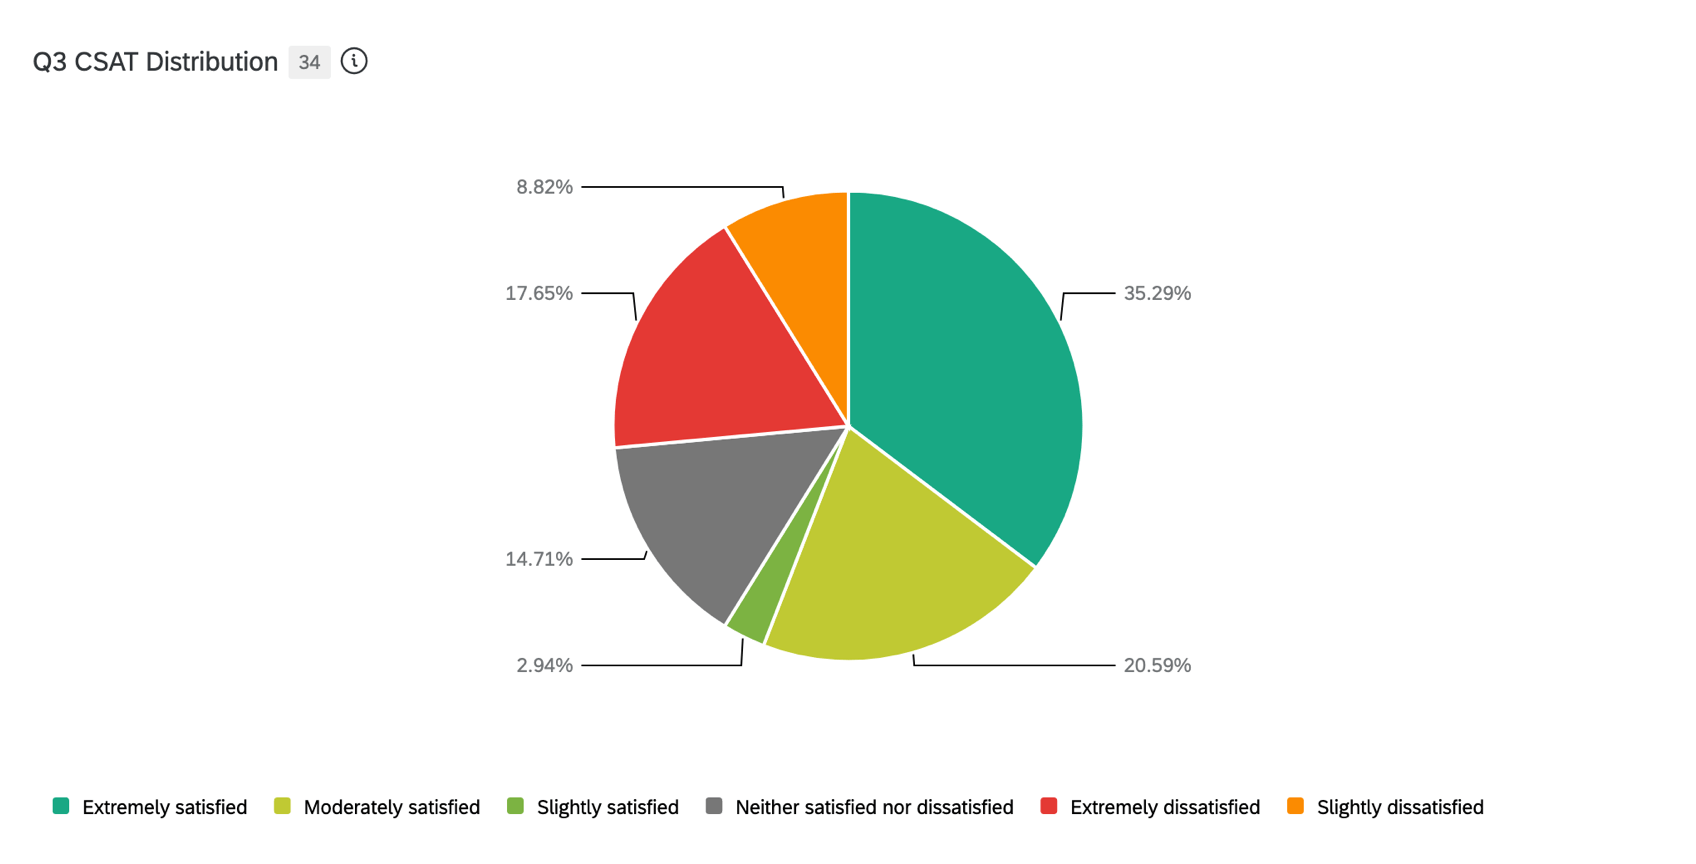
Additionally, pie charts can be employed to represent parts of a whole, making it easy to see how different segments compare to a benchmark. For example, a pie chart could illustrate the market share of various companies within an industry, with one segment representing the benchmark company. This type of visualization helps to convey proportions and percentages effectively, allowing viewers to quickly understand how each entity contributes to the overall picture.
Lastly, x, highlighting key factors that contribute to the differences observed. By combining qualitative insights with quantitative data, one can create a comprehensive picture that not only shows the comparison but also explains the underlying reasons for any discrepancies. This multifaceted approach ensures that the audience fully understands the context and significance of the comparisons being made.
