Vizhealth.org is a dedicated platform that specializes in the visualization of health data, aiming to enhance the accessibility and comprehension of complex health-related information. The website offers a variety of tools and resources designed to assist users—ranging from healthcare professionals and researchers to educators and the general public—in creating clear, engaging, and informative visual representations of health data.
By leveraging advanced visualization techniques, Vizhealth.org enables users to transform raw data into intuitive graphics, charts, and interactive dashboards. This not only aids in the interpretation of intricate datasets but also facilitates better communication of health trends, outcomes, and statistics to diverse audiences.
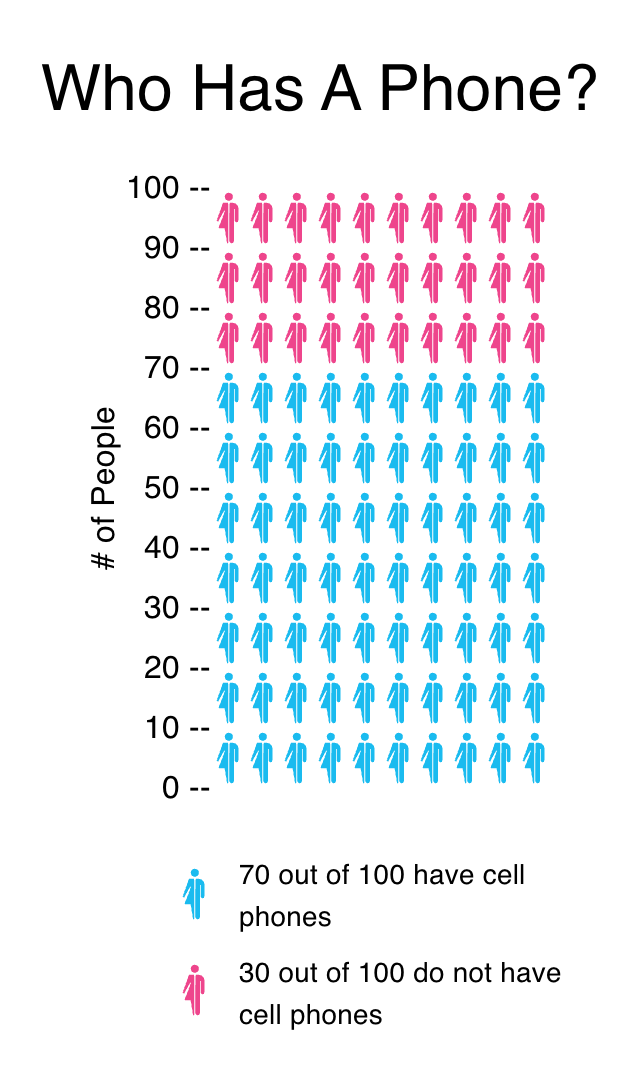
After messing around with their Icon Array tool, I can conclude that I found this tool and whole website in general very helpful. It is an valuable resource for putting information together into a visual. When data is presented in charts or graphs, it becomes clearer and more engaging, allowing viewers to quickly grasp trends and patterns. This visual representation can also make it easier to communicate findings to others, making discussions more effective and informed. For my visual I made, I just used some simple statistics on how many people out of 100 have a cellphone.
