Examples of Insightful Infographics
Robert Kosara shares in Visualization Criticism- The Missing Link Between Information Visualization and Art, that there are many different classifications in data visualization. However, the following criteria are a minimal set of requirements for any visualization: information is based on (non-visual) data, it produces an image, and the result is readable and recognizable. There are many different examples of insightful infographics within this general definition, and below I will share a few common types of infographics that can be insightful and help convey a message to an audience efficiently and effectively.
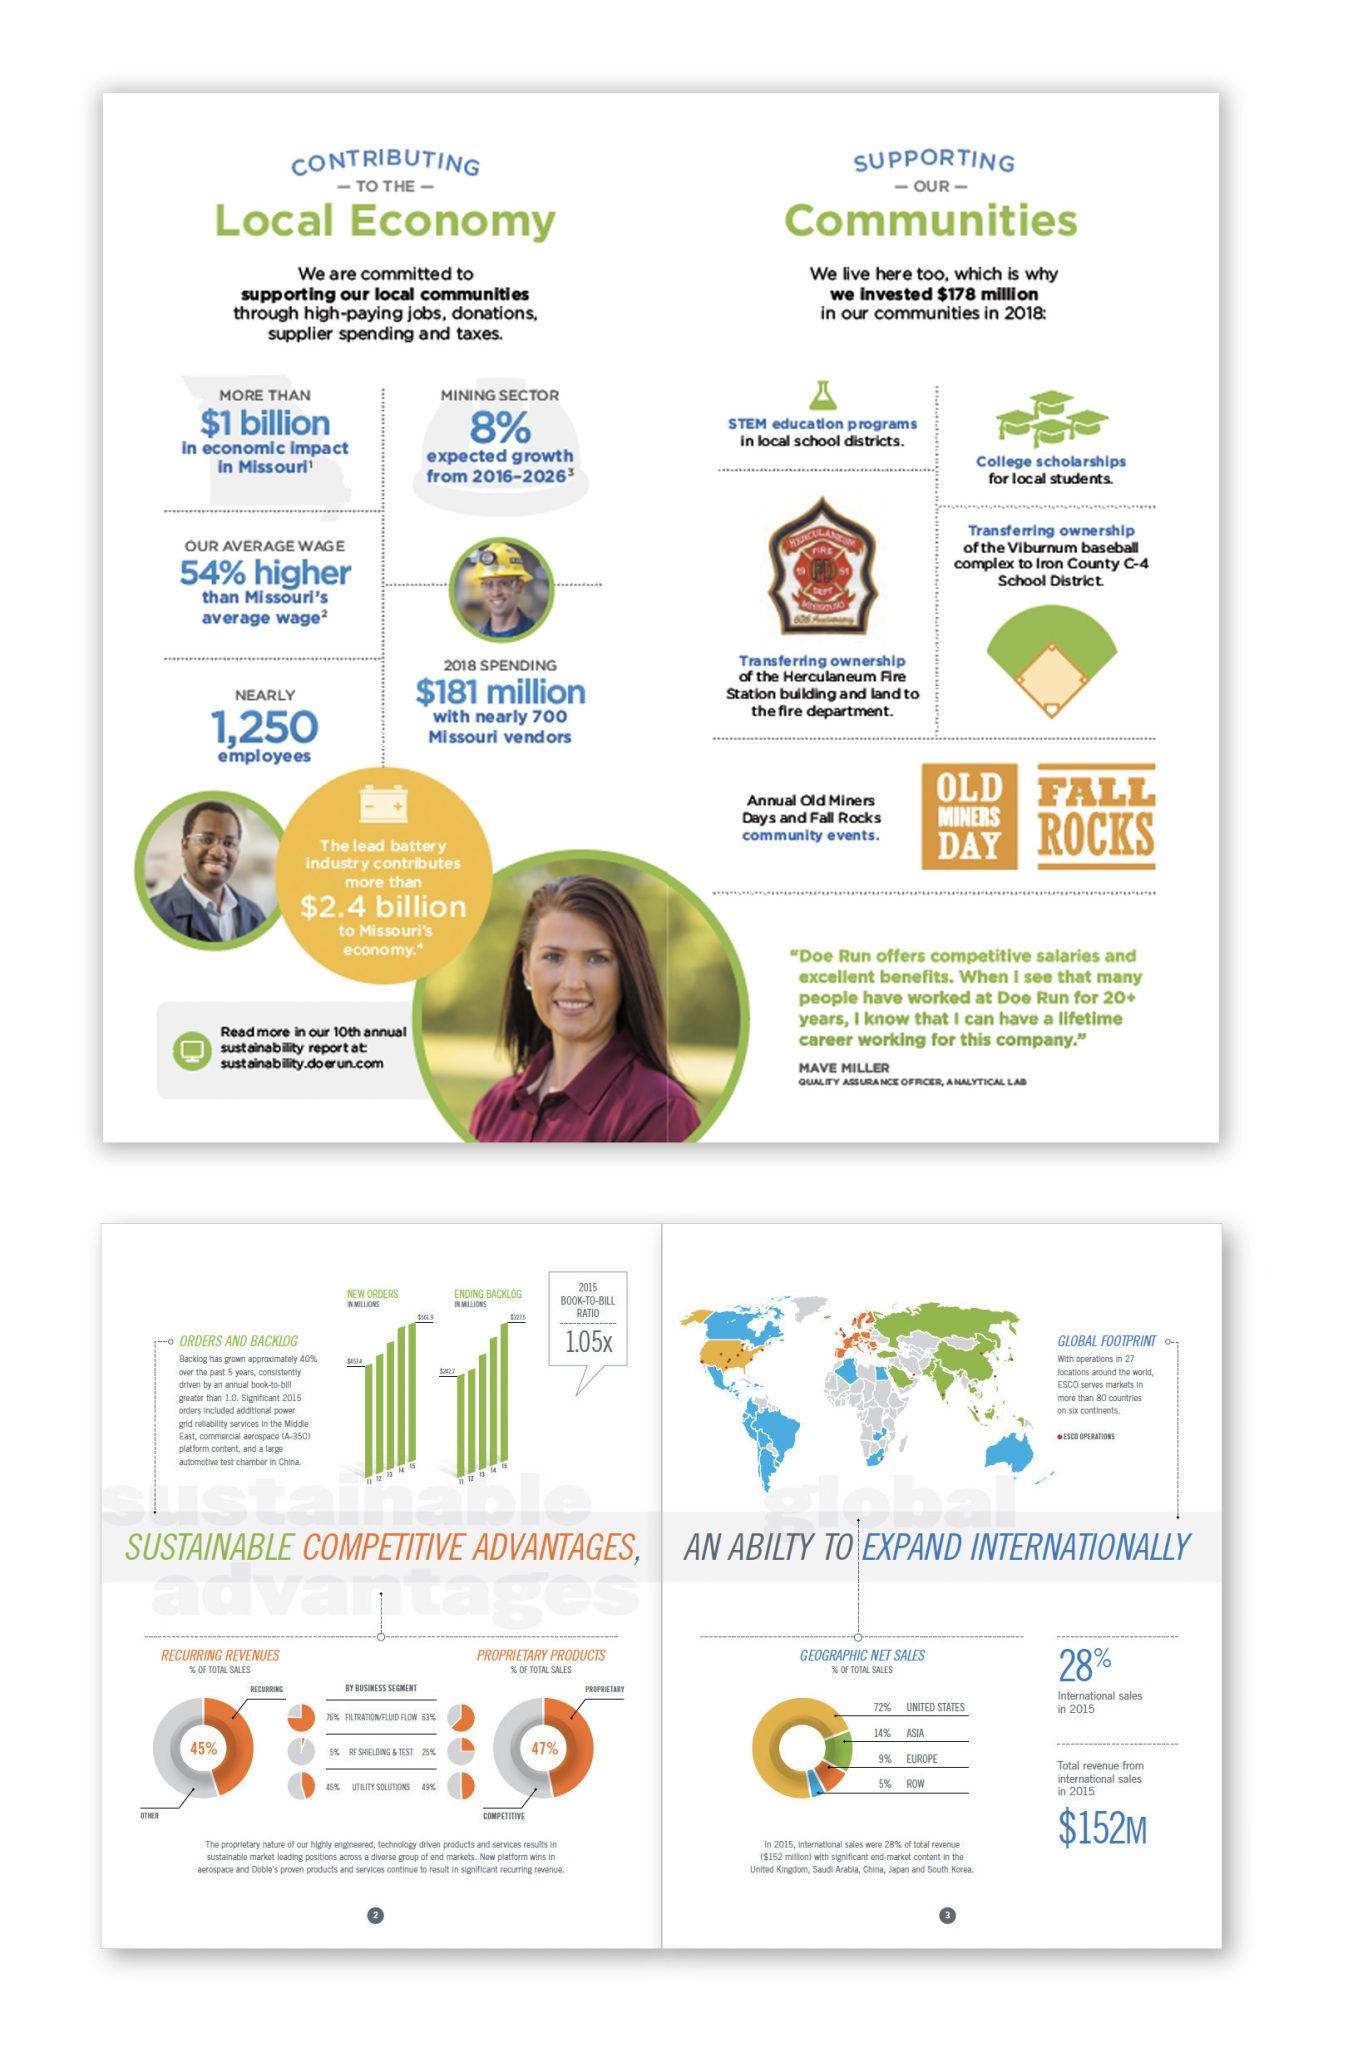
- Mixed Charts Infographics
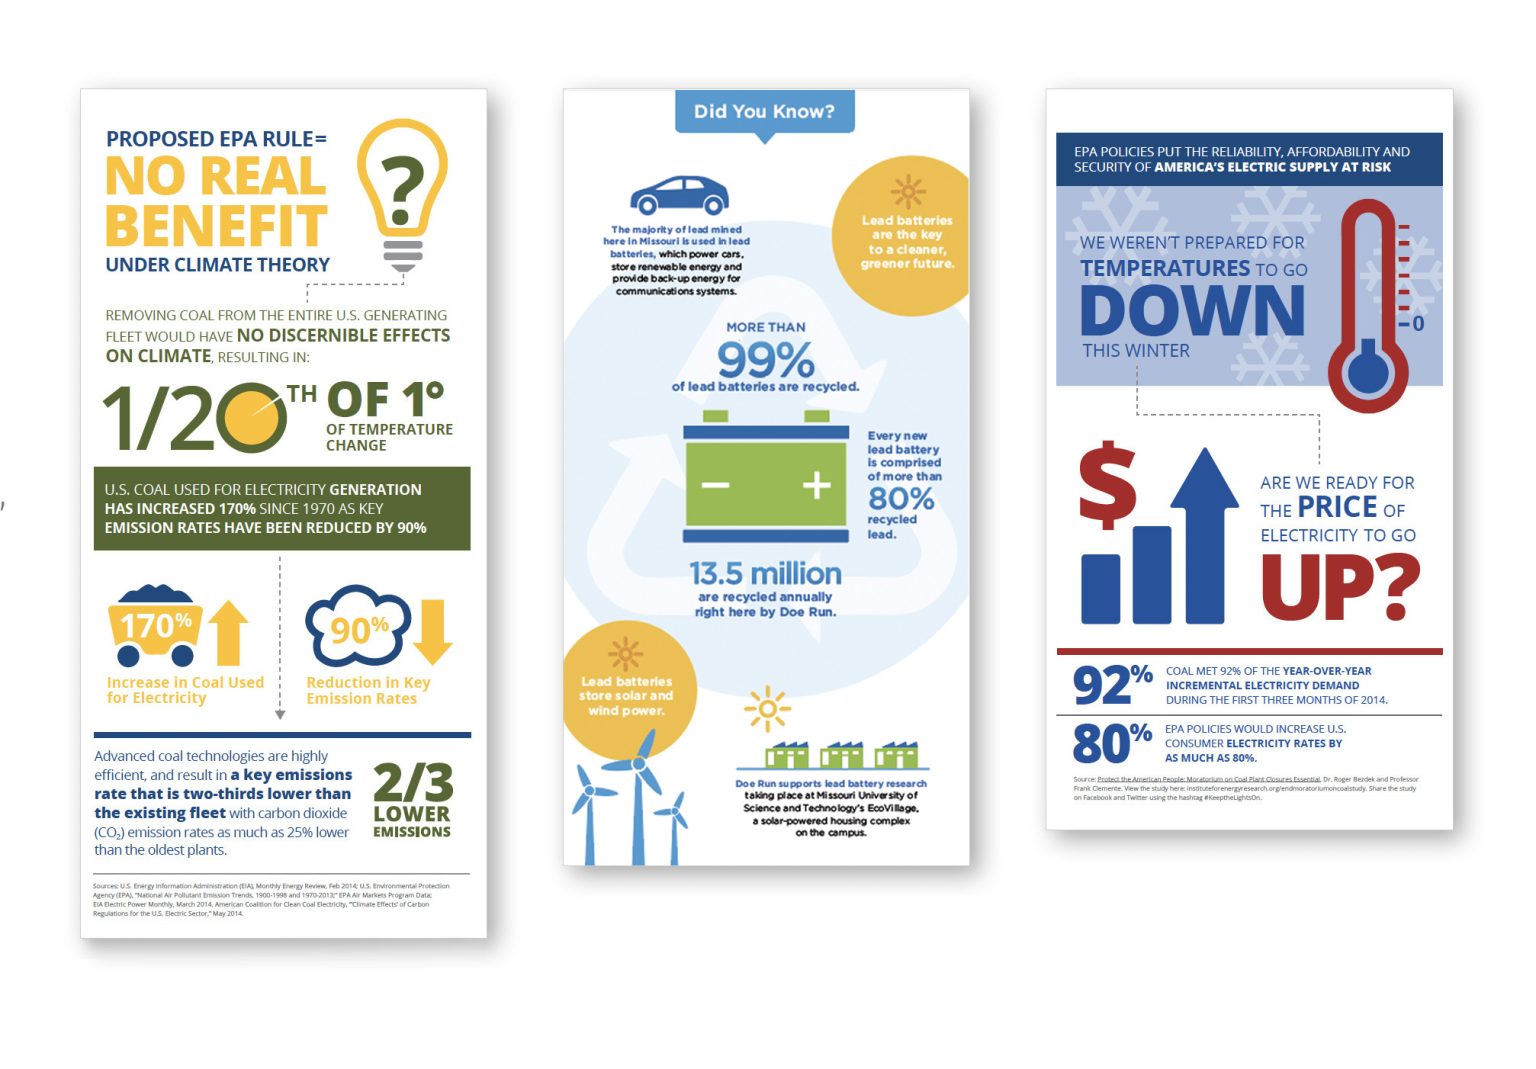
2. Informational Infographics
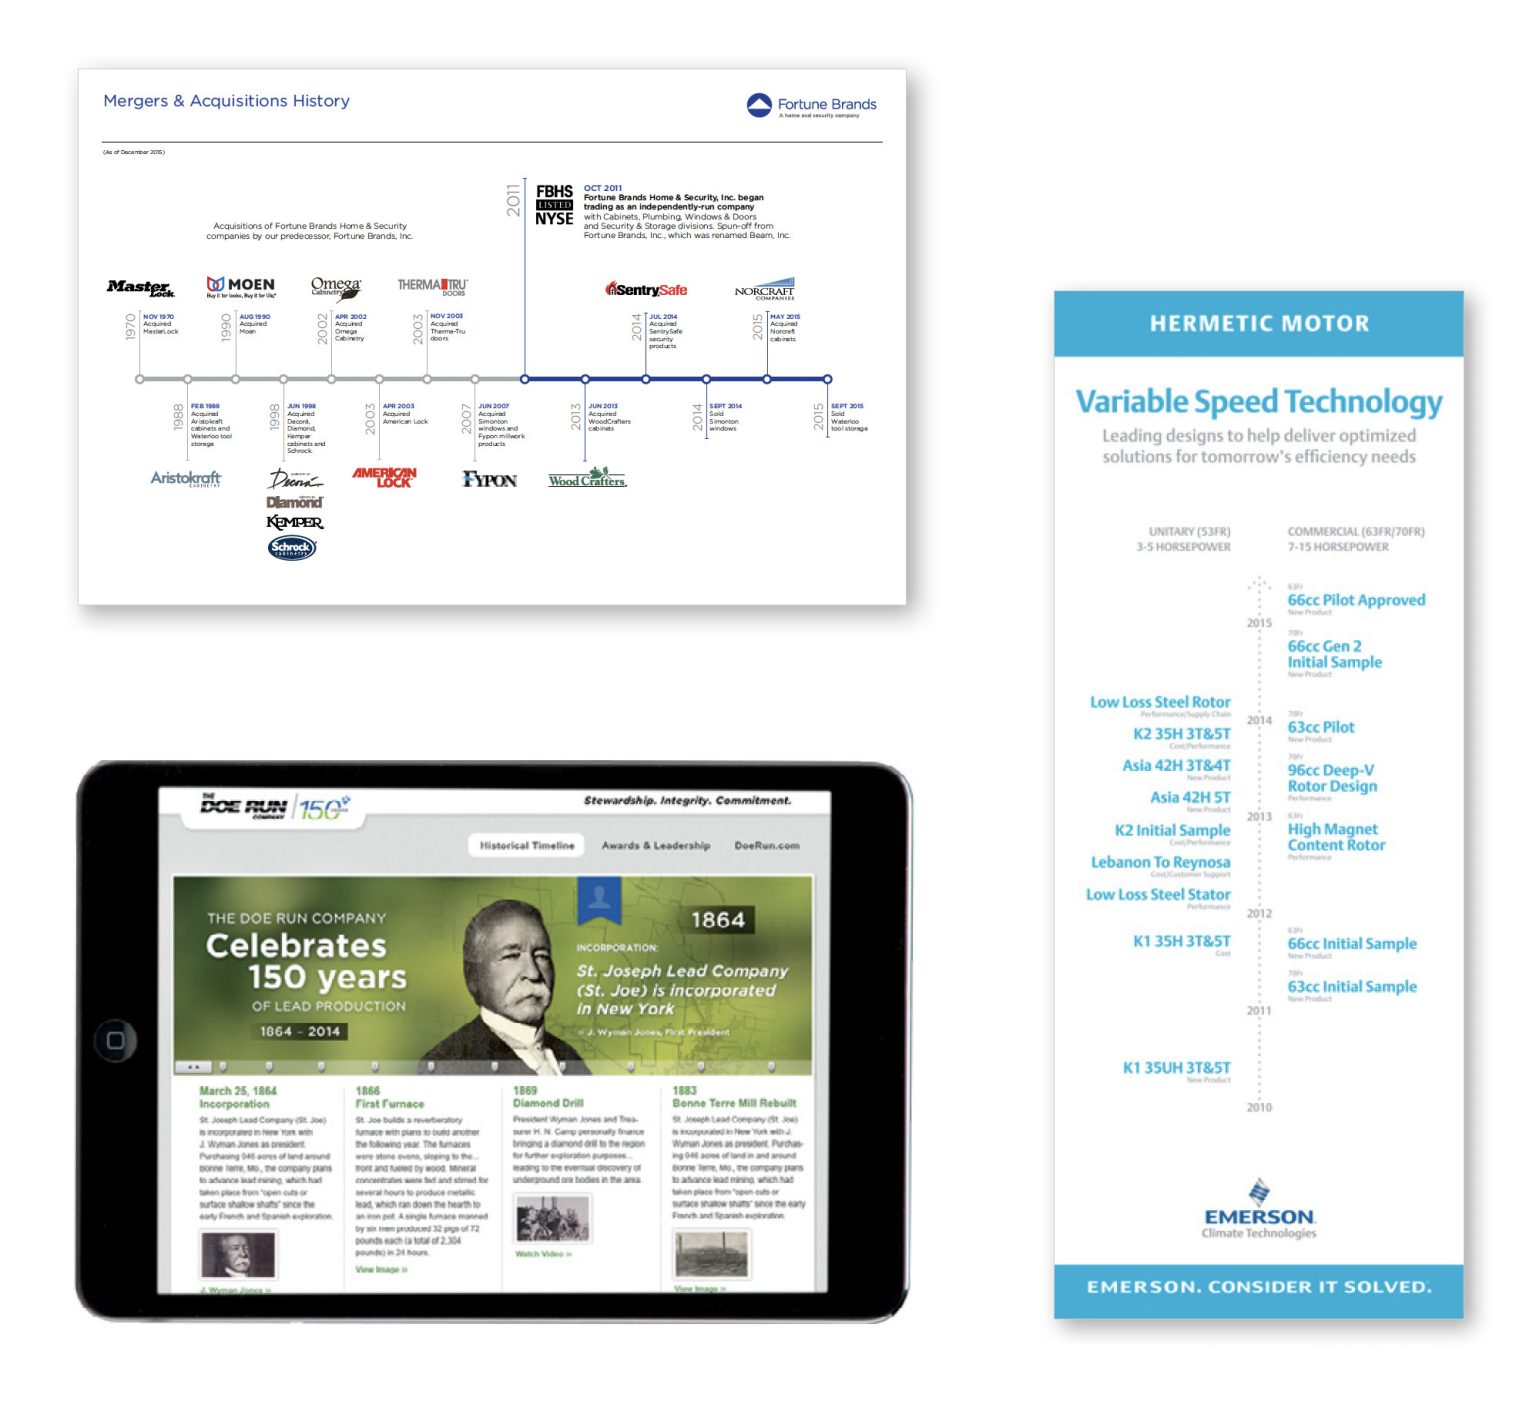
3. Timeline Infographics
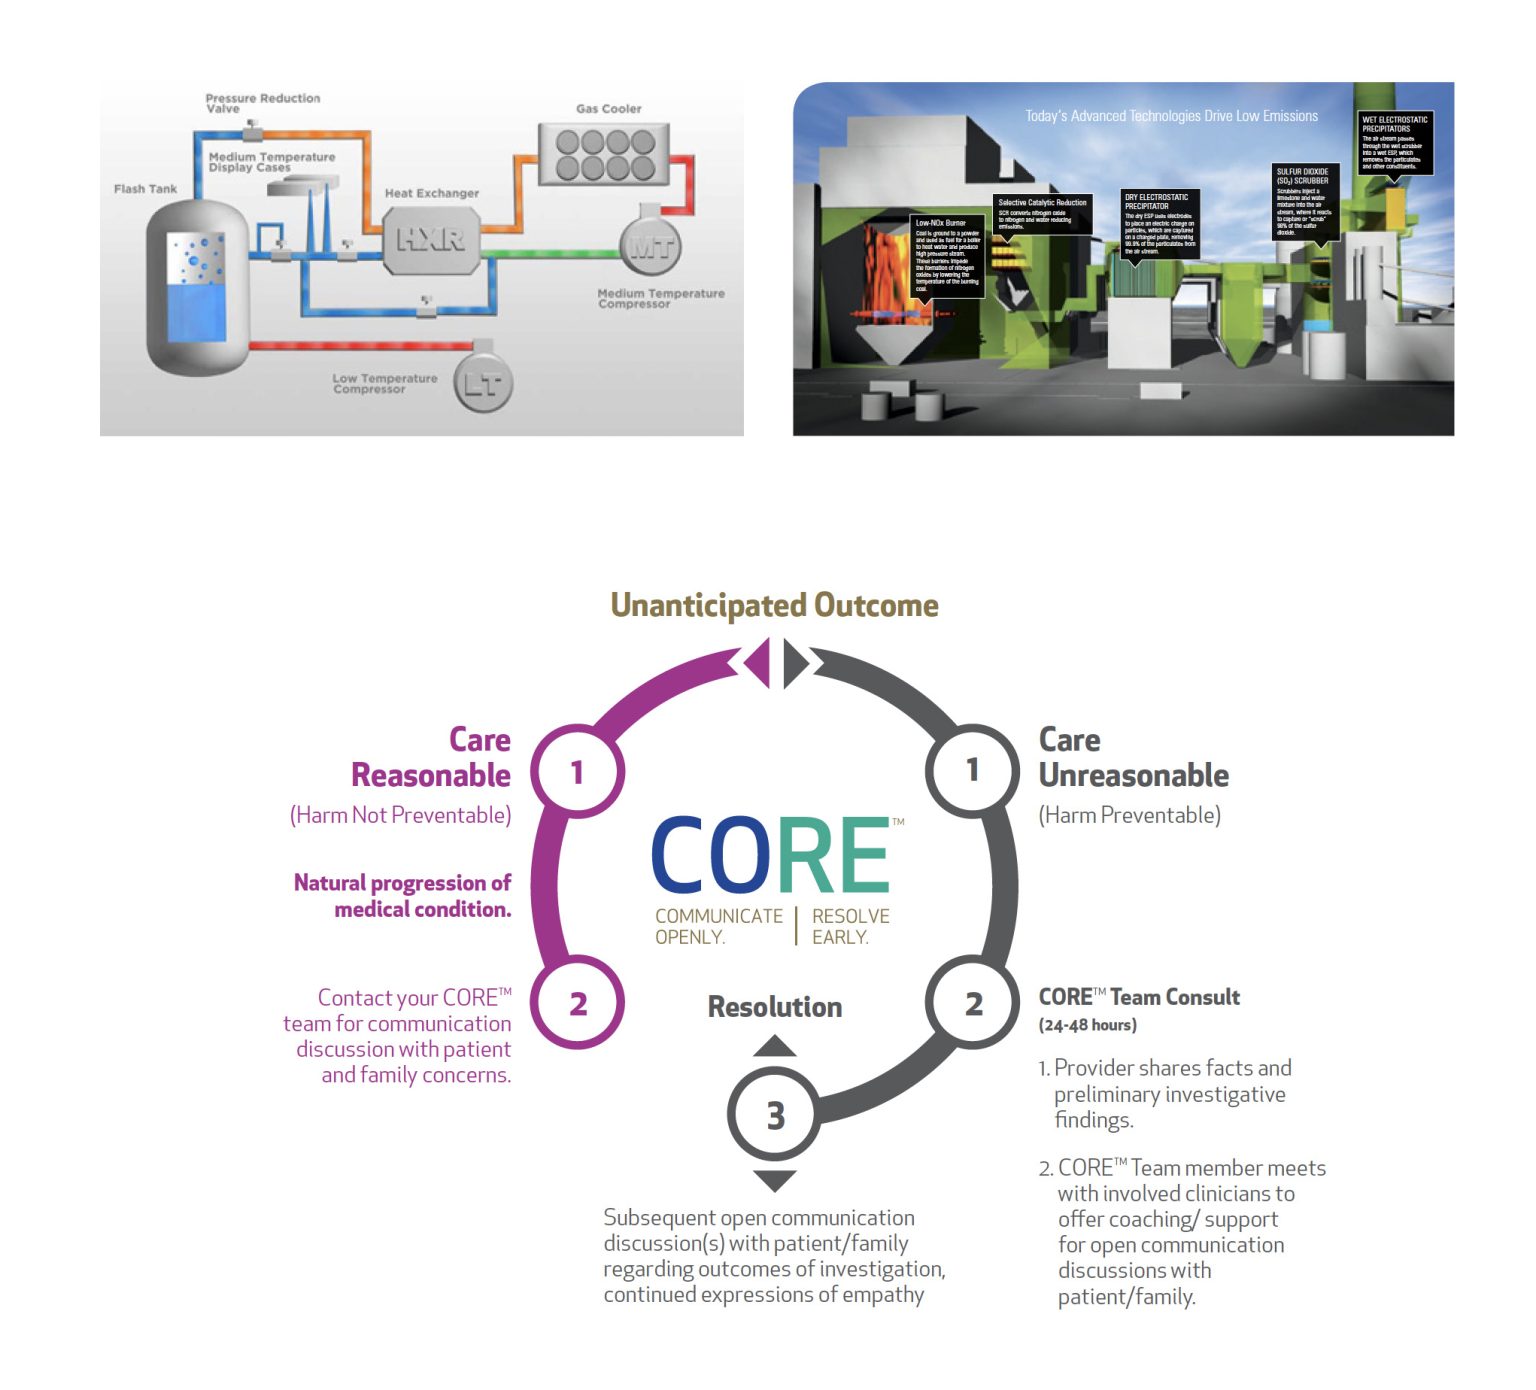
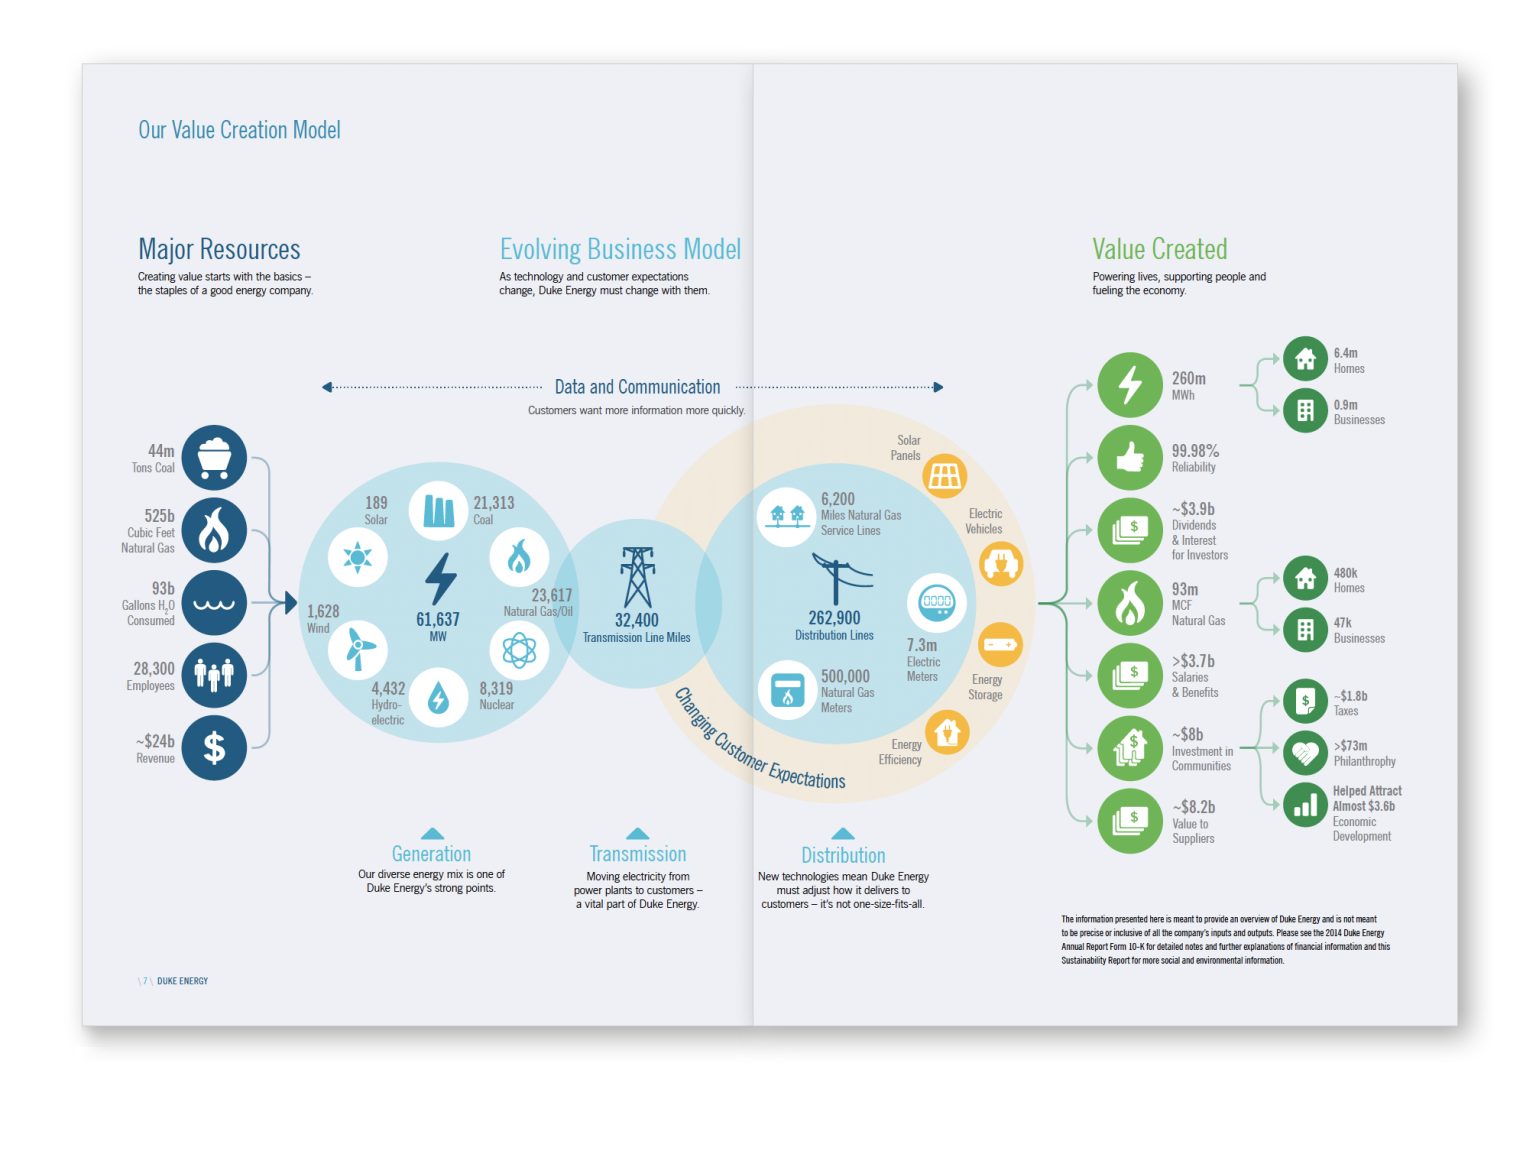
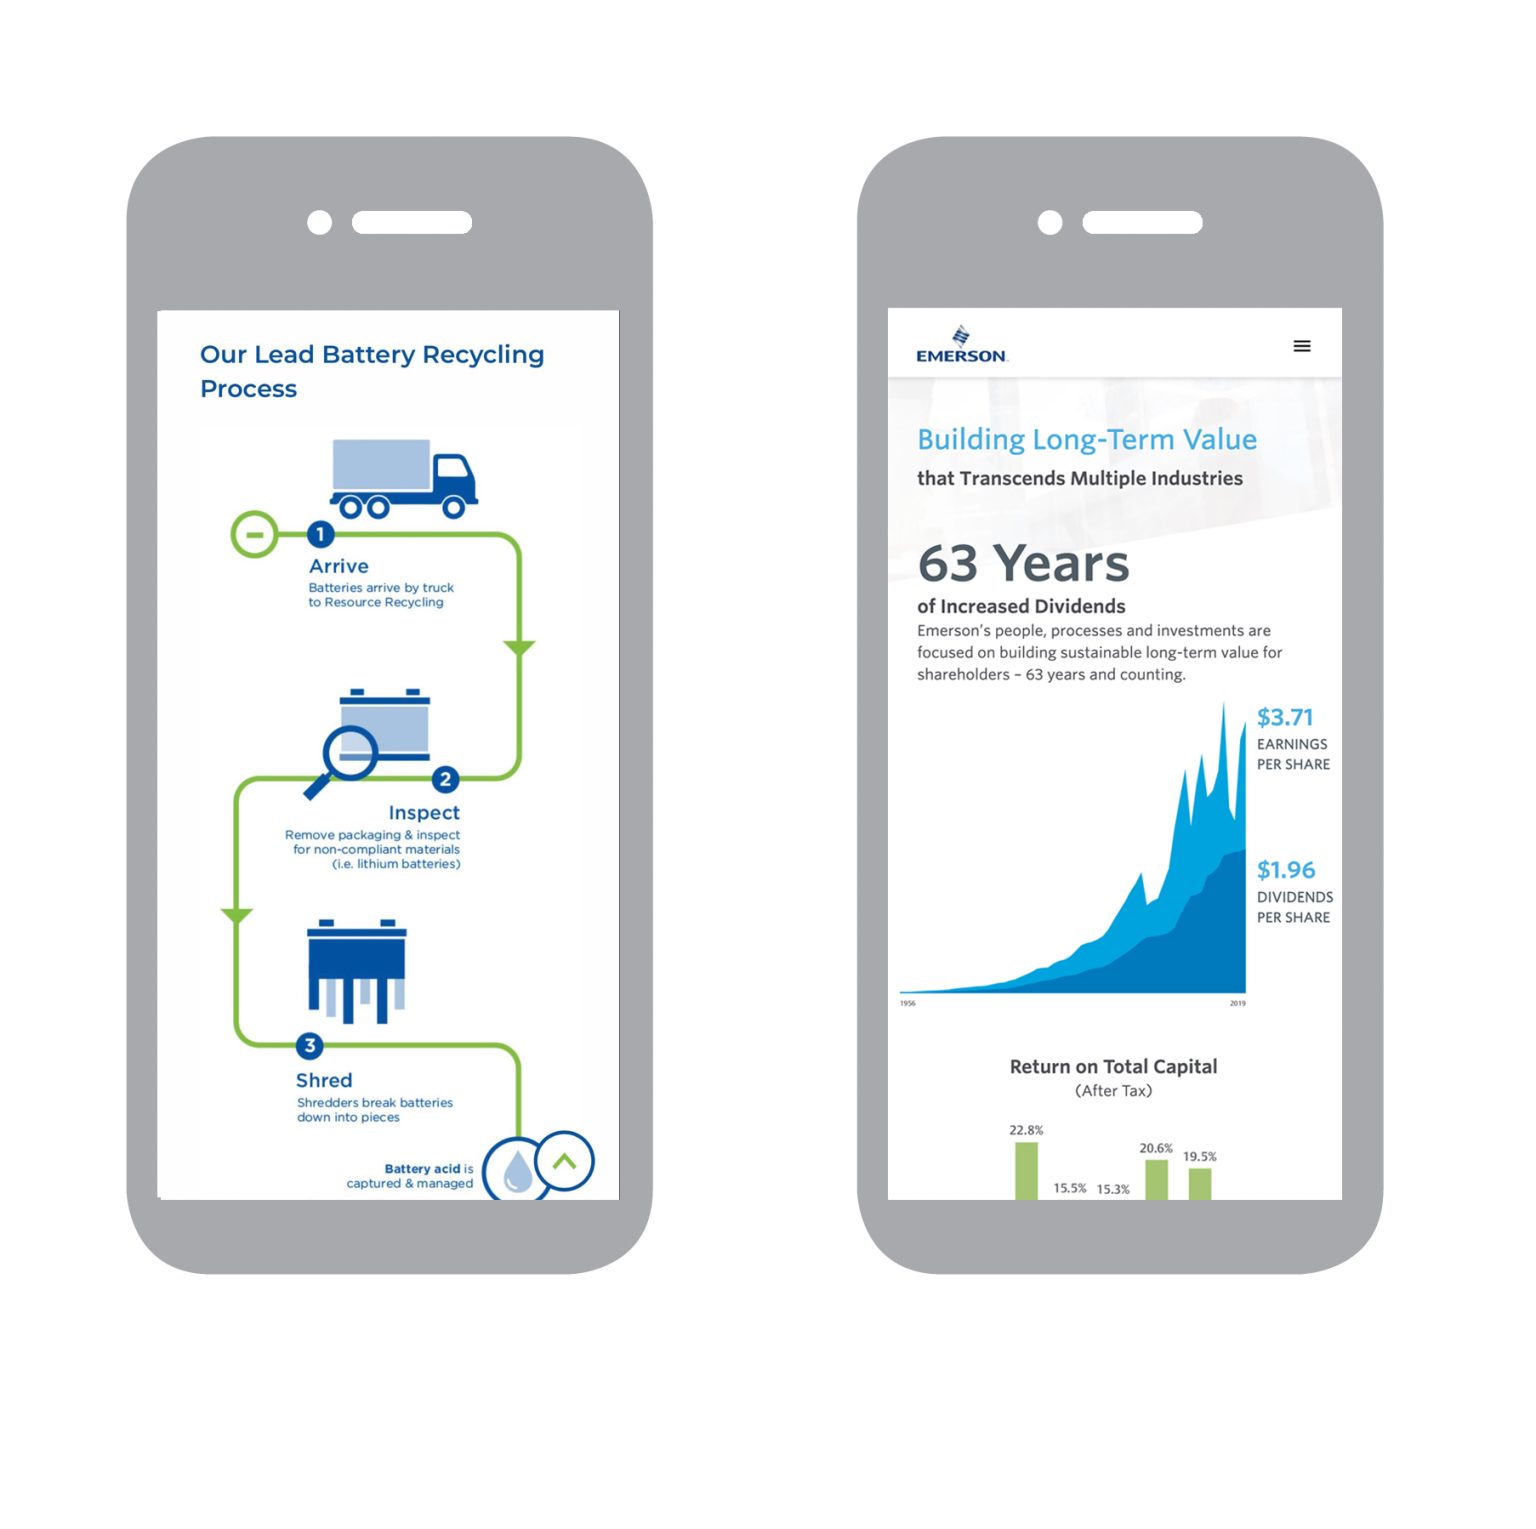
4. Flow Chart Infographics
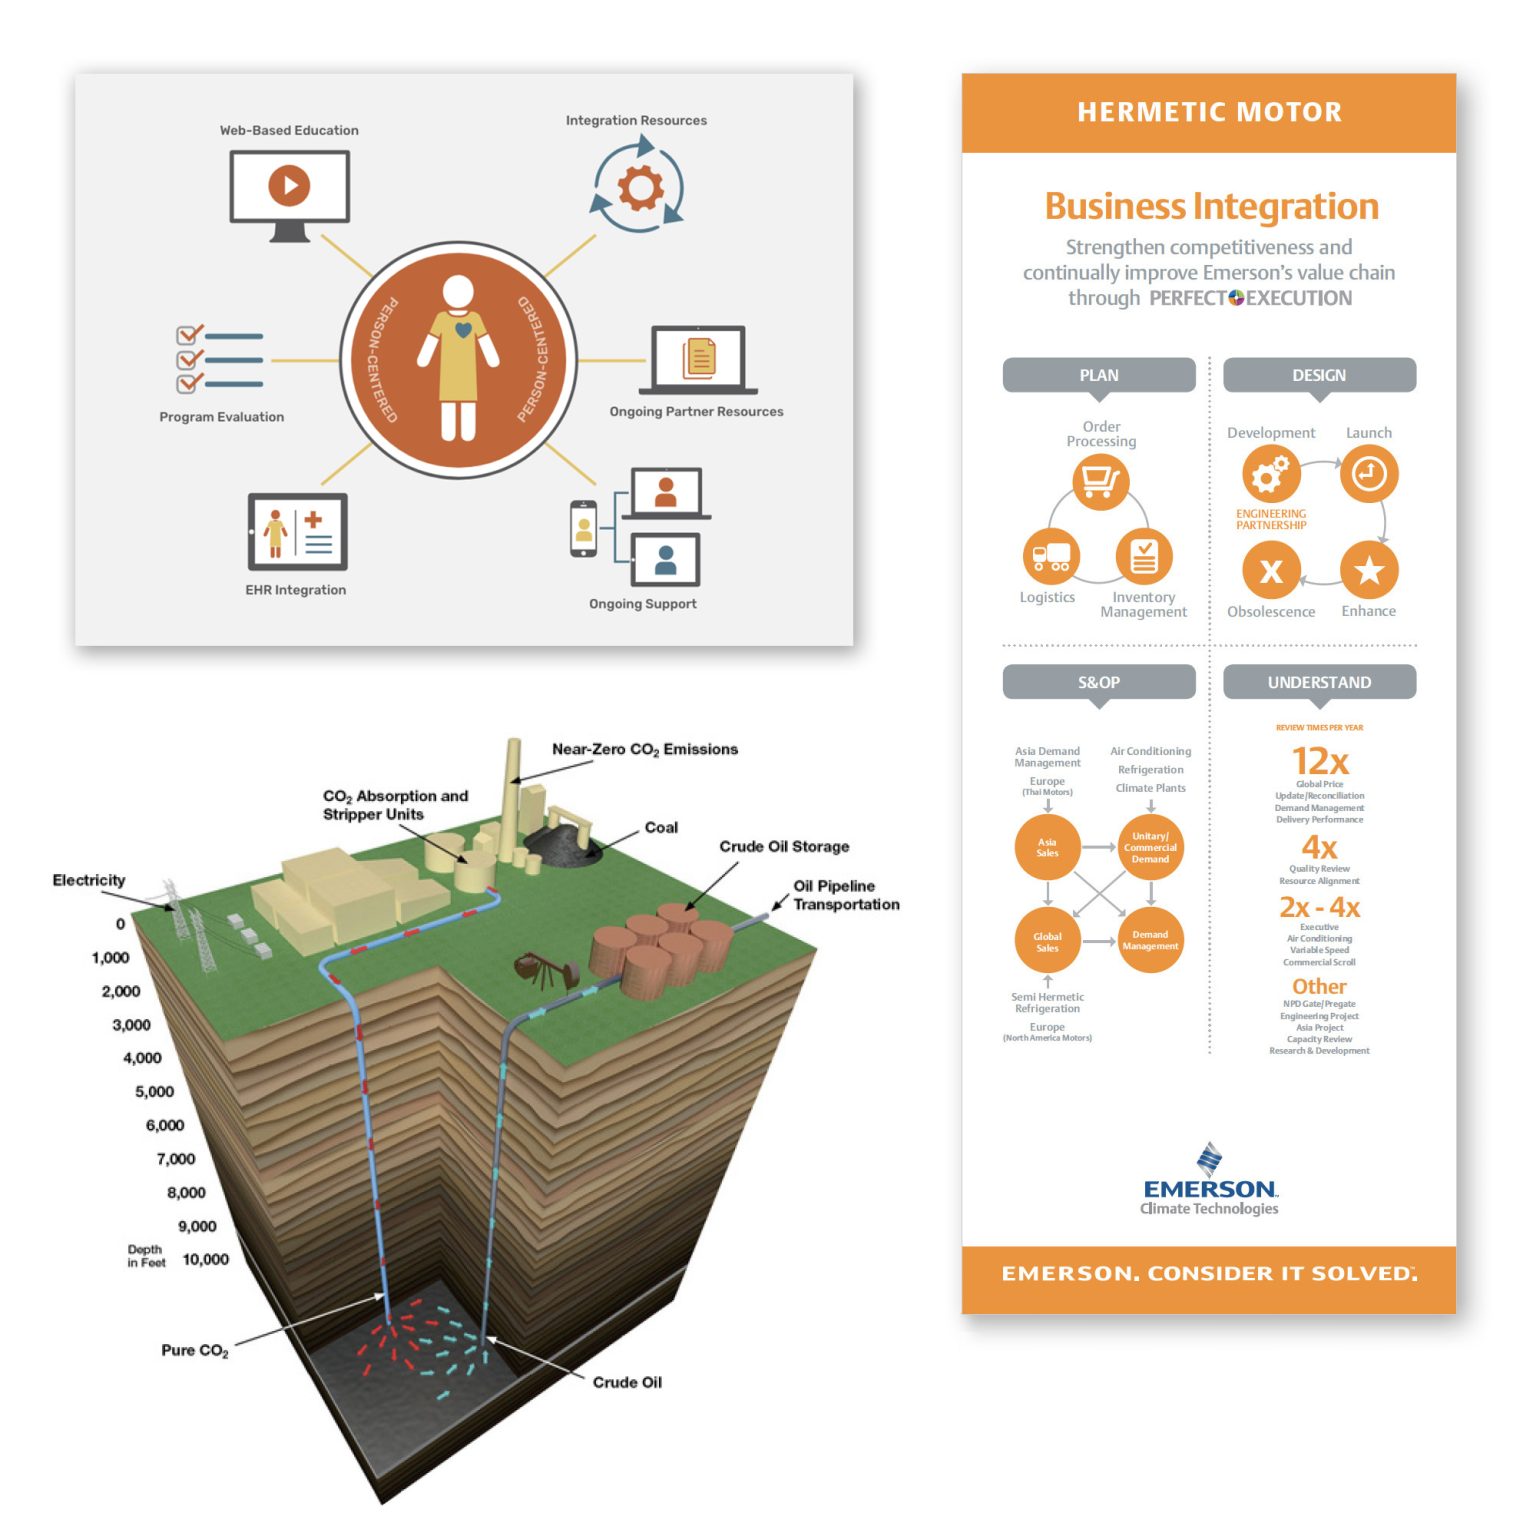
5. Process Infographics
6. Comparison Infographics
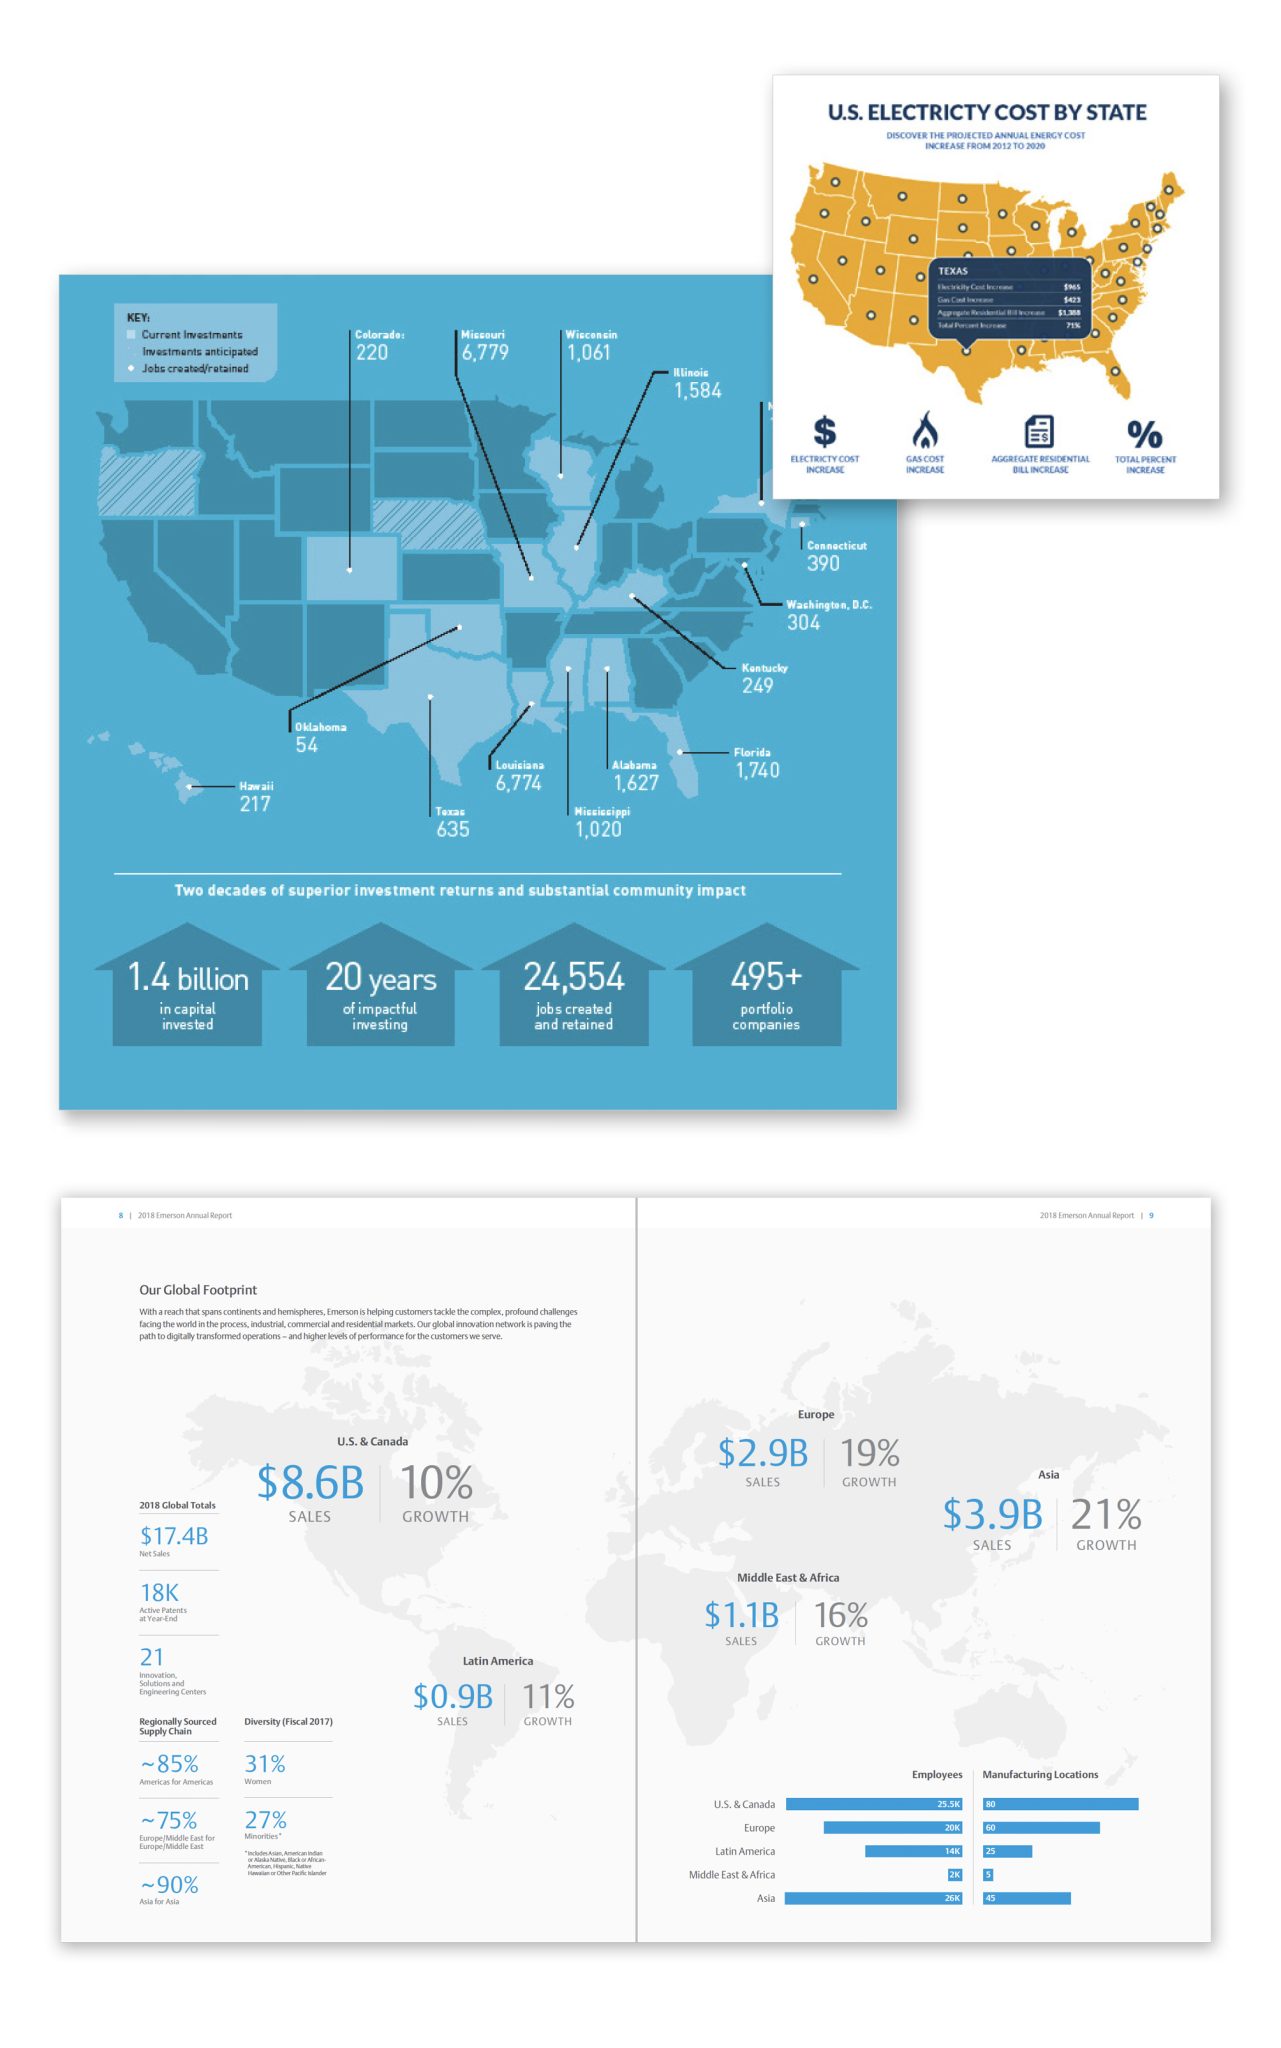
7. Location Infographics
8. Photographic Infographics

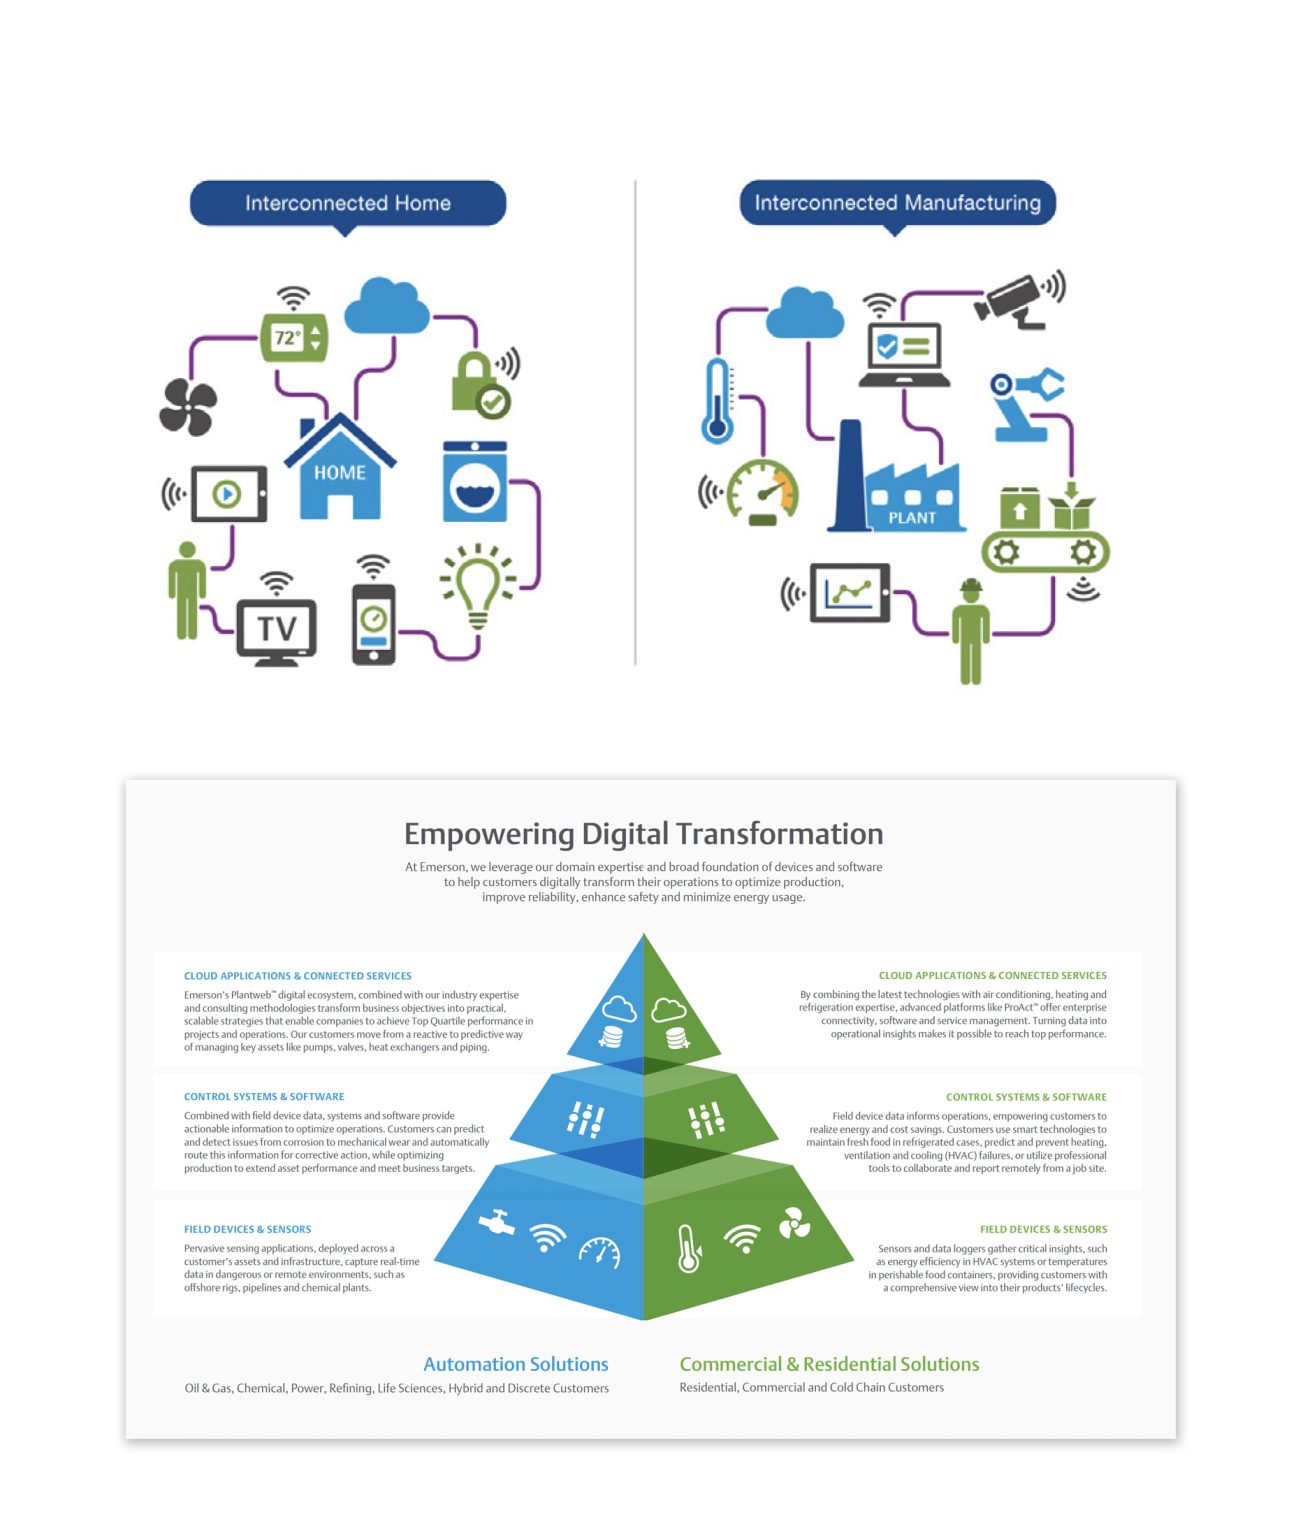
9. Hierarchical Infographics
10. Interactive Infographics
All of the infographics listed above are different types of commonly used infographics. It is important to note that these are all from one website, and there are many other infographics that are commonly used to convey information.
Sources:
R. Kosara, “Visualization Criticism – The Missing Link Between Information Visualization and Art,” 2007 11th International Conference Information Visualization (IV ’07), Zurich, Switzerland, 2007, pp. 631-636, doi: 10.1109/IV.2007.130. keywords: {Art;Data visualization;Bridges;Computer science;Visual communication;Computer graphics;Handicapped aids;Mice;Joining processes;Concrete},
Prow, B. (2024, July 24). Common types of infographics and when to use them. OBATA. https://obata.com/10-types-of-infographics/