Benchmarks are an incredibly fast and effective way to provide a significant amount of context to a graphical display of information. This can be done in many ways, such as with a line or single symbol indicator. Benchmarks are most often used in financial matters; however, they still may prove useful for other purposes. In financial context, evaluating benchmarks may allow for insight into shifts in business over time. Whereas establishing benchmarks can allow businesses to more accurately gauge the performance of their employees as well as provide some motivation for progress.
In a New York Times article written by Clifford Krauss, he covers the significance of the dropping fuel demand in relation to how this affects oil suppliers.
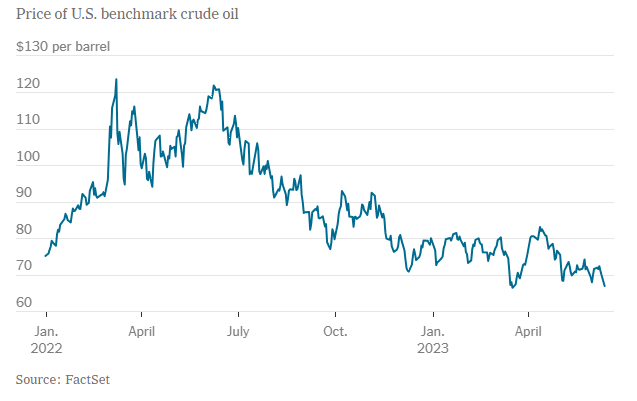
In the graph above, there is a clear trend of a dip in crude oil prices in the U.S. over the course of a little over a year. The benchmark of concern that was mentioned in the article, is $80 per barrel of crude oil. In a bold attempt to increase oil prices by cutting production, Saudia Arabia may have inadvertently caused the opposite effect to occur. Allies of the OPEC Plus cartel (Saudia Arabia included) have shown concern over this value remaining at or below $80 per barrel of crude oil. I feel as if the significance of this value may be better illustrated by highlighting this lines value differently than the others.