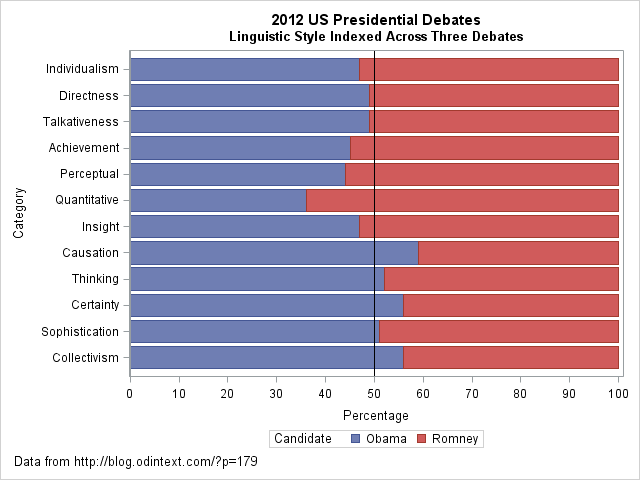
I came across an interesting dataset and a corresponding visualization that compared the characteristics of Barack Obama and Mitt Romney during the 2012 US presidential debates. The graph in question is a radar plot displaying 12 characteristics of the candidates’ words during the debates. These characteristics include “directness,” “talkativeness,” “sophistication,” and more.
However, I found the radar chart a bit challenging to interpret effectively when comparing the two candidates. I’d like to discuss two valuable tips that can make such comparisons clearer when using graph visualizations:
- Graphing the Differences: When comparing two groups, it’s often more intuitive to graph the differences between them rather than plotting each group separately. This can help viewers focus on what sets the groups apart. In the context of the 2012 debates, this could mean creating a graph that visually emphasizes the differences in characteristics between Obama and Romney, making it easier to identify distinctions in their speaking styles.
- Sorting Categories by Meaningful Quantity: In any plot that has a categorical axis, it’s essential to sort the categories by a meaningful quantity. This ensures that the visualization effectively conveys the message you intend. For instance, if the radar chart includes characteristics like “directness” and “sophistication,” consider sorting these characteristics in a way that highlights the most relevant differences between the candidates.
As for the dataset provided, it appears that the numbers represent the relative percentages of each characteristic attributed to Obama and Romney during the debates. For example, in the category “Individualism,” 47% of the phrases were attributed to Obama, while 53% were attributed to Romney.
By Shaun Sneddon
https://blogs.sas.com/content/iml/2013/08/21/comparing-two-groups-graphically.html