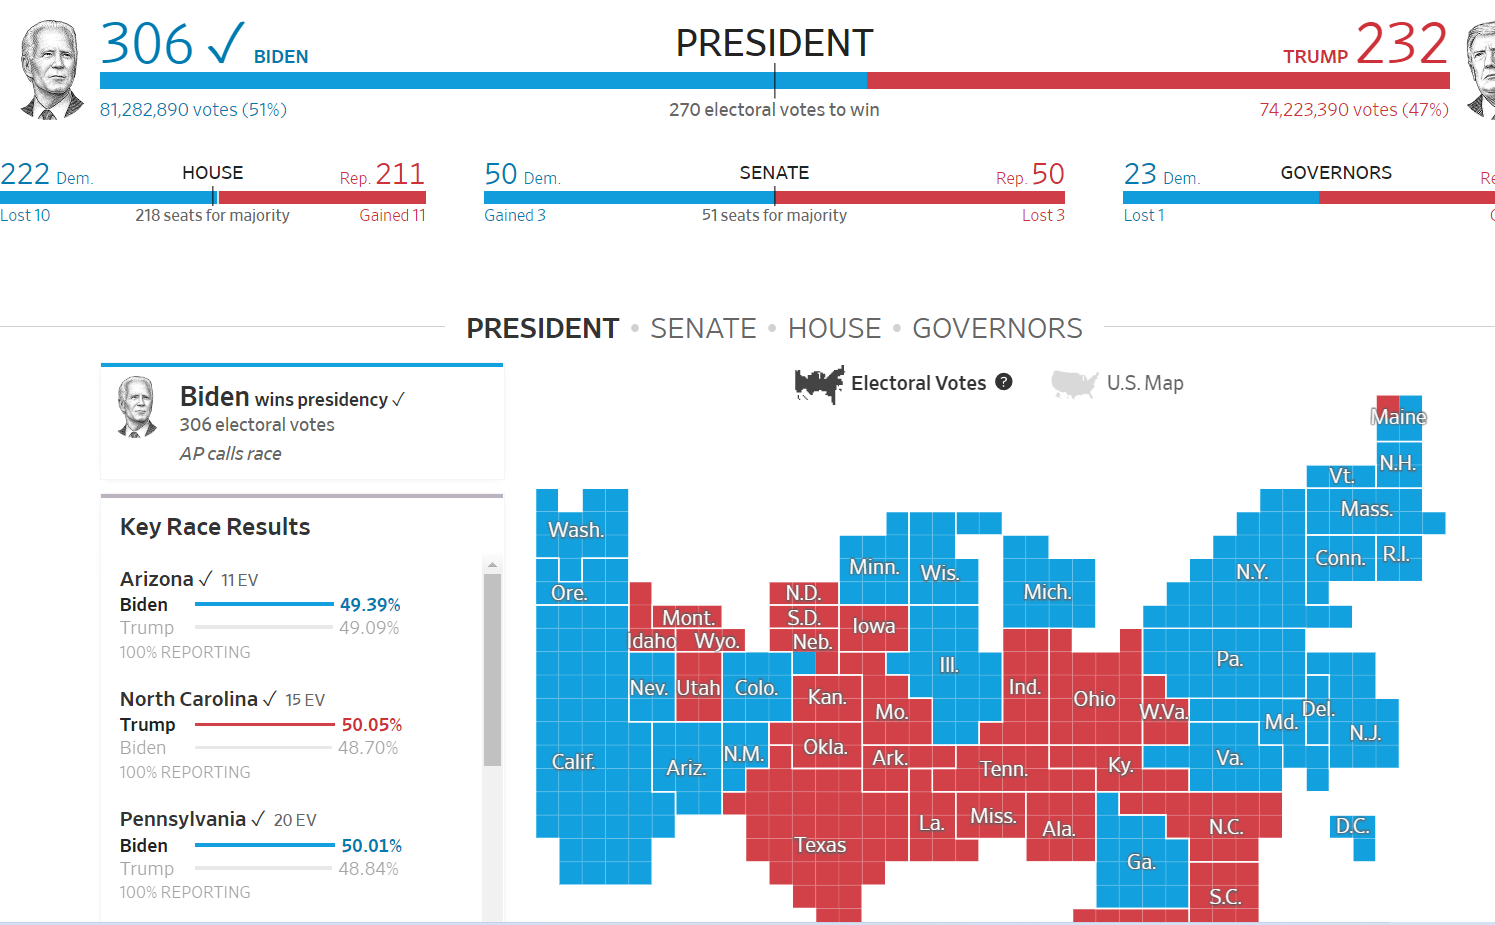
When comparing data across multiple categories it is crucial for the reader to understand the graph first. A good graph will label their axis’ along with the numerical values of their data. When analyzing the graphs, the reader can use the similarities between the graphs and the data to compare them. Through this comparison of data, a deeper understanding of the graphs can be reached. Visualizing the data makes comparing data especially easy, as the reader can quickly go from graph to graph reading the data. An article from Medium.com further explains the importance of visualizing data, the author states “humans will face a lot of difficult time interpreting datasets because normally human eyes can’t process a lot of information simultaneously, which is the job of data visualization to make it easier for us to understand.” This quote makes it easy to understand why data visualization is important when comparing numbers and data