Tools that may help us construct visualizations that compare numbers.
Before researching the tools that help us construct visualizations that compare numbers, through this class, it was primarily about infographics or, more importantly, different types of charts. Charts help us by visually representing data, making complex information more accessible and understandable.These visual representations, such as bar graphs, line charts, and scatter plots, enable us to identify trends, patterns, and outliers in datasets effortlessly. They serve as powerful tools for conveying insights and supporting data-driven decision-making processes. Exploring the various chart types and their applications has been a fundamental part of our journey in mastering data visualization.

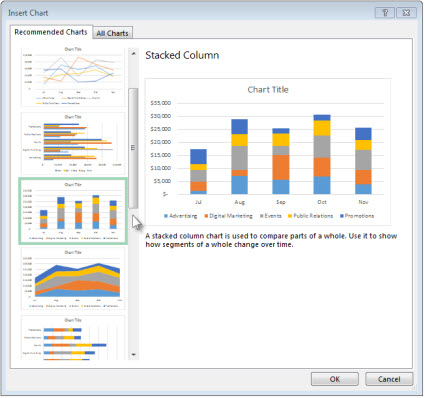
Through researching and this class, excell is the easiest and most effective tool in hrlping onstruct visualizations that compare numbers. Excel helps construct visualizations that compare numbers by offering a user-friendly Chart Wizard, data sorting and filtering capabilities, customization options, and interactive features. It also provides the flexibility to work with various data sources and create professional-looking charts and graphs, making it a versatile tool for data analysis and presentation.
Some cool things about Excel include its comprehensive help options, allowing users to type in queries and receive relevant results. Additionally, the abundance of online resources, forums, and tutorial videos makes it easy to find solutions to any difficulties you may encounter while using Excel for data visualization, benefiting from its widespread popularity. Also, Excel’s consistent updates and improvements ensure that users have access to the latest features and functionalities, enhancing their capabilities for creating even more dynamic and insightful visualizations for comparing numbers.
sources