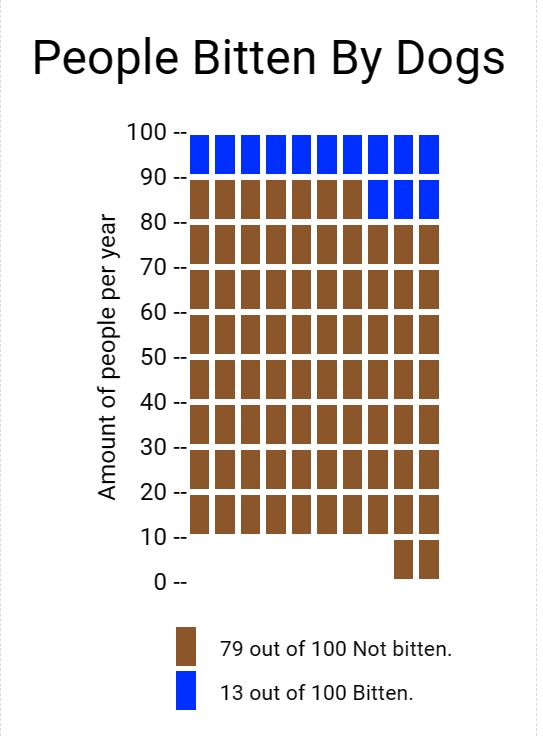
My experience using icon array was good. I enjoyed how easy the cite was to use and navigate. The array tool was very easy to use. I think this tool can be very beneficial for data analysis and visualization. I developed this array on the percentage of people who were bitten by dogs per year. As you can see the data is very easy to visualize and understand, which is why I like this method of data presentation. I believe others should use array icon too in any type of presentation they may have.