Pivot Tables are an essential tool in Excel that are useful for organizing and grouping large amounts of information. They are extremely versatile and can be used for a numerable amount of ways. By using pivot tables you can turn clumps of data into meaningful and insightful information that can be used for analysis. Some practical uses are in finance analysis, sales analysis, product information, inventory analysis, and more.
Above, we see sales analysis for produce. It is well organized and easy to interpret.

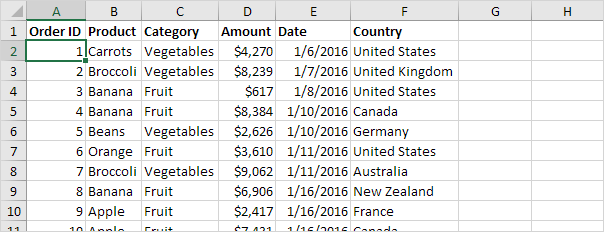
Above, we see another practical use of pivot tables for sales analysis. We can see here the sales for each product, the year it was made, and the category each product falls under.
Overall, pivot tables are useful for anything that needs to be organized into multiple different categories. From there, you can filter using the drop down arrows that prove to be extremely useful with many entries. Since in Excel, you can then make charts and other analysis more readily.