Pivot tables help provide incredible insight for larger, more complex data sets, where end users are able to vary the functionality of the tables to better suit their needs. For example, a use case for a pivot table would be using it to manage inventory management. By implementing an inventory management system into a pivot table, we are able to see what items are used most frequently, identify less commonly used items that a business may have in stock, and could go a step further and implement a customer analysis pivot table with the data derived from the inventory management system.
In short, a pivot table summarizes large, complex data sets that can then be used to generate insights depending on which way the data leads it. The reason why they are so widely used is because of the simplicity they offer for the end user, allowing the user to know minimal skills but still create a very valuable data-driven tool through excel.
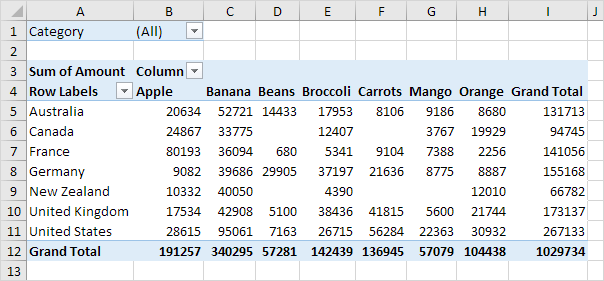
In this example, we can see how end users can manipulate this data set to see which countries have the most fruit, export the most fruit, or even rank them accordingly to biggest producers of each fruit! The possibilities of uses can go on, but the most important takeaway is to learn how to use the functionality within the pivot tables!