Sankey Visualizations
Needtoknow.nas.edu provides many visualizations about energy usage in the United States. I learned that the flow of energy in the U.S. is complex and comes from numerous different sources. More than half of energy supplied is lost as waste heat or through inefficiencies.

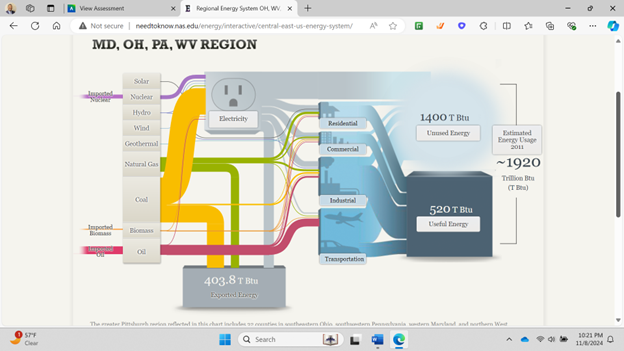
This Sankey visualization breaks down our energy system from the source all the way to its usage. As you can see, Oil is the largest source of energy with a total output of 36% and total CO2 emission of 43% in the U.S. Although this visual is interactive and provides a large amount of information/data, I find Sankey visualizations to be difficult to interpret. There is a lot of data being displayed within a single visual, and it would be more effective to break it down into multiple different visualizations. For example, the data regarding % of Total Output and % of Total CO2 Emissions could be visualized as a Side-by-Side Column Graph. Another example could be the use of a Pie Chart to compare the % of energy used and unused.

This visual of Lumens per Watt for different types of lightbulbs is highly effective. The visualization clearly shows which lightbulb they are talking about and its lm/W. Viewers can interpret the graph efficiently due to its simplicity. This particular chart is a good example of a Large Number With Icons, as we have learned in the textbook.

Another good visualization is this Back-to-Back Bar Graph displaying the efficiency of energy on the road. You can compare energy used, gasoline burned, CO2 vented, and fuel economy between the two different types of vehicles. Again, the simplicity of this chart makes it more effective.
I believe this site would highly benefit from simplifying their visualizations. The data they want to explain would be easier to interpret, therefore, more effective if they were to take a more minimal approach.
SANKEY Visualizations

A SANKEY diagram is used to show the connections between different values. In this case this diagram is about our energy system. I think this is a perfect representation of when a SANKEY diagram should be used. There is a variety of values here that are interconnected. In this diagram in particular, the viewer can see that oil is mainly used for transportation and industrial use. I can clearly se that coal is mainly used for electricity. I believe these diagrams could get a bit confusing, however, here it is clear with the different colors to indicate the values of the sources of energy.
Sankey Interpretations
Lamar Miller
Based on what I learned about Sankey visualizations, it appears coal is our largest resource contributing to electricity production. In addition, oil is used primarily for transportation. Overall, I would say this is a good use of a Sankey visual. The color coding within the visuals allows the viewer to decipher between the different resources. The thickness of each bar indicates the quantity. The flow of each resource to its intended use case shows which resources flow into which utility. Source

In the MD, OH, PA, WV region there is a large amount of coal production.
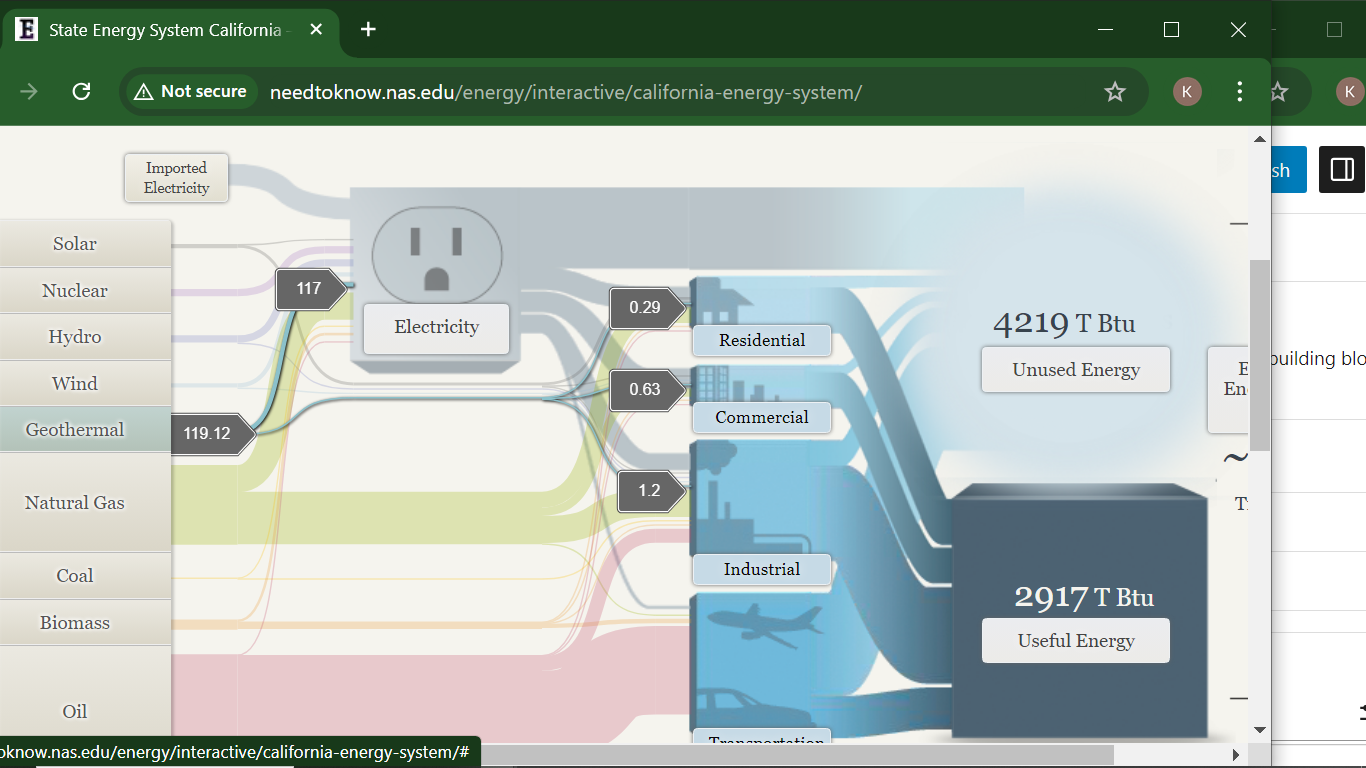
California has very minimal coal production but uses natural gas as an energy source more commonly.

Sankey
After reviewing the blog titled “What You Need To Know About Energy” (http://needtoknow.nas.edu/energy/energy-use/) i really enjoyed how the information is presented and how the site is laid out. At the top of the page we have four main navigation buttons that give the broad topic about what that page is going to cover. Within that page the data is broken down into other sub topics based on the main topic. Each sub topic has a small blurb about it and uses colors and a slightly larger text to highlight key points of the sub topic. I had no idea how much our energy consumption affects things such as security and the different energy generation forms we can use to create energy.
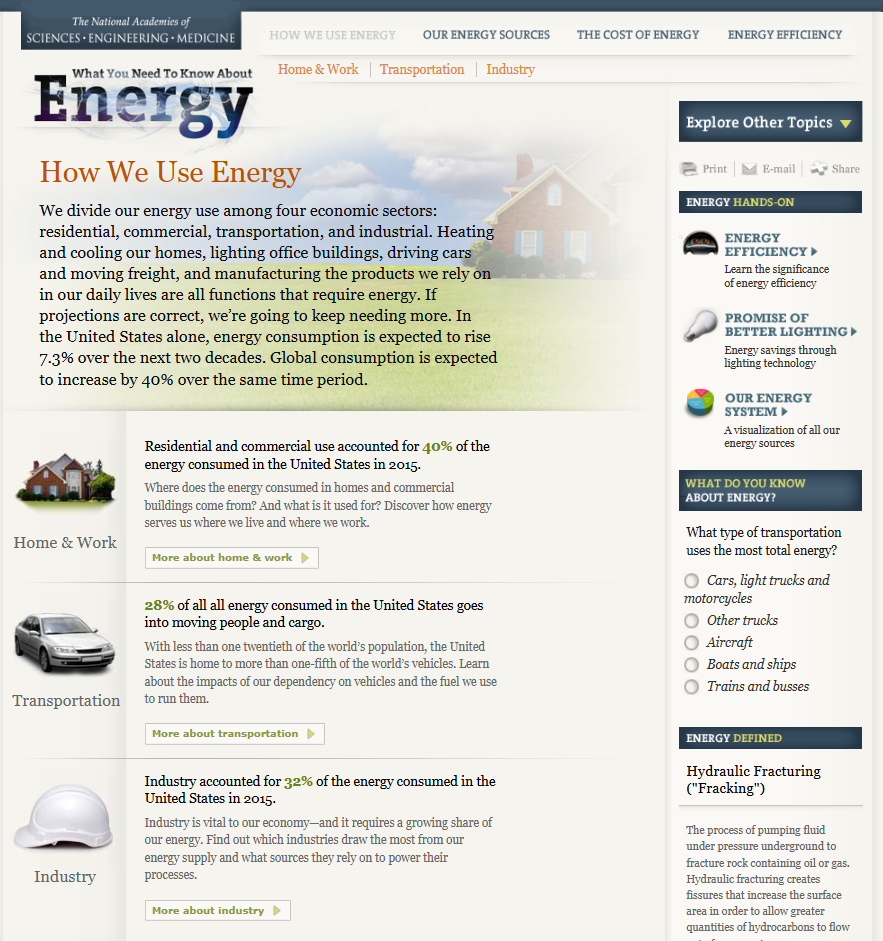
If you click on the sub topic you will get a more in depth explanation about it and reveals any charts used to represent the data.

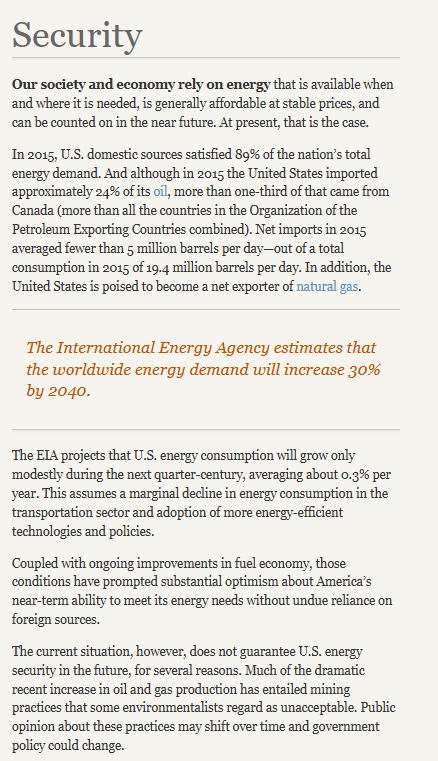
While this seems to be more of a professional setting and display of data I believe the author could have used more visuals and less text to more efficiently display the various statistics referenced throughout the blog. For example this page does not have any visual representation. Rather then writing about the international energy estimates the author could have used a single large number or even a donut or pie chart with a large percentile and contrasting color to highlight the significances of this estimate and what it means specifically for our security in this instance.
Sankey Diagram
Overview of the Sankey Diagram
The Sankey diagram effectively illustrates the complex relationships between various energy sources and their end-use applications. It shows how energy flows from primary sources (like fossil fuels, nuclear, and renewables) to different sectors, including residential, commercial, industrial, and transportation.
Key Findings
Energy Flow Representation:
The diagram visualizes both useful and unused energy, highlighting that a significant portion (~59.4 Quads) is wasted, primarily as heat. This effectively communicates the inefficiencies in our energy system.
Interactive Features:
Users can click on different energy sources (e.g., solar, wind, hydro) to see detailed information and visualize their contribution to useful and unused energy. This interactivity enhances engagement and allows users to explore specific data points more thoroughly.
Comparative Analysis:
The representation of renewables alongside traditional fossil fuels on a similar basis helps demystify their efficiency relative to conventional energy sources. This is a strong point of the visualization, as it underscores the role of renewables in a comparable framework.
End-Use Efficiency: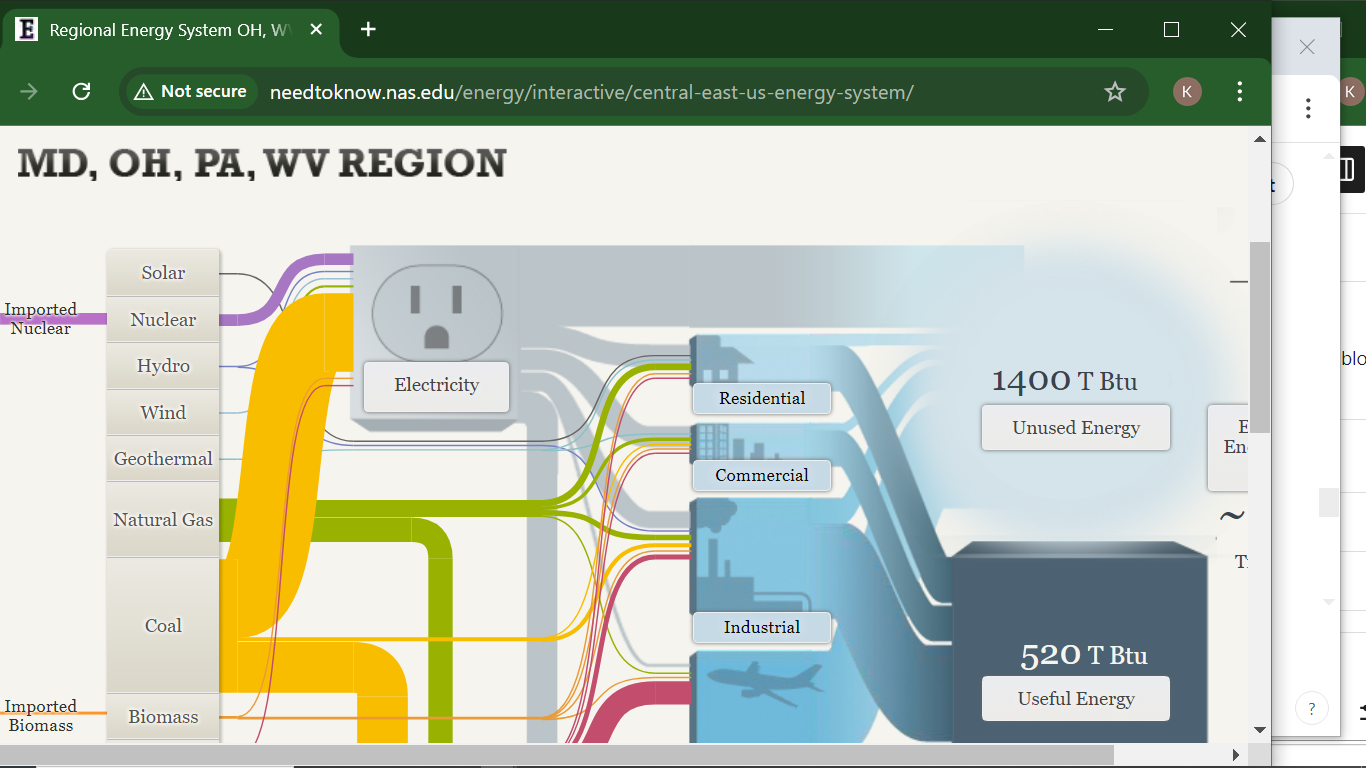
The efficiency metrics provided for various sectors (65% for residential and commercial, 80% for industrial, and 21% for transportation) are crucial for understanding where improvements are needed. However, the stark contrast between the transportation sector and others raises questions about potential reforms.
Critique of the Sankey Visualization
While the Sankey diagram is effective, there are areas for improvement:
Complexity:
For some users, the complexity of the diagram might be overwhelming. Simplifying the design or providing a guided walkthrough could enhance comprehension, especially for those unfamiliar with energy systems.
Static vs. Dynamic Data:
The diagram focuses on 2014 data, which may not reflect current trends. Regular updates or an option to view historical data trends could provide deeper insights into how energy usage patterns have evolved over time.
Alternative Visualizations:
Other visualization methods, such as bar graphs or pie charts, could complement the Sankey diagram by providing quick visual cues about the proportions of different energy sources or waste versus useful energy. This could help in communicating key takeaways at a glance.
Narrative Context:
The addition of narrative context or case studies could help users understand the implications of the data. For example, linking specific energy sources to current policy discussions or technological advancements would enrich the learning experience.
Conclusion
The Sankey diagram on the website serves as a powerful tool for visualizing the energy flow in the U.S. It successfully highlights the interplay between energy sources and their efficiency. However, incorporating user-friendly features, updating data, and using supplementary visualizations could enhance its effectiveness and accessibility. As the energy landscape evolves, such tools will be vital for educating the public about energy use and efficiency.