It is important for people who know how to read data to understand how privileged they are when assessing public information. Although, luckily, sometimes information is displayed in a way that is easily digestible to the average person, sometimes there are graphics involved that are aimed to convey information, but they are not easily understood by those who are not well-versed in data or graph reading.
Luckily, sites such as VizHealth give users the opportunity to learn in real time the ways that information can be displayed in an infographic. Using the risk calculator, individuals can input their own personal information and get an easily assessable visual of their personal risk for cardiac disease. The additional explanation under the bar graph aids in the user’s understanding of this tool.
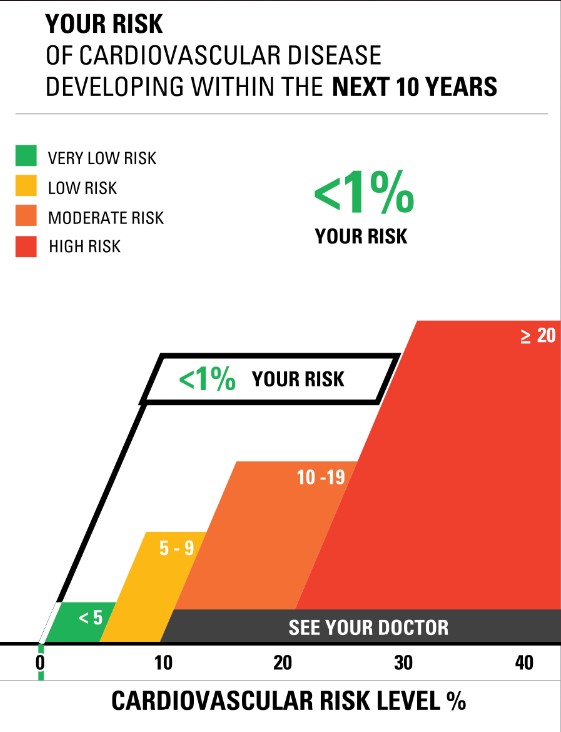
As you can see, the layout of the graph that is displayed above is user-friendly and can be easily understood. Simple coloration is used and the information that is pertinent is magnified and displayed in a bold font, which draws the attention of the viewer.
Icon Array Generator
VizHealth offers an additional service which offers users the chance to visualize statistics. Through multiple google searches, I assessed the prevalence of multiple ailments that plague the American population today. By seeing how many individuals out of 100 were liable of contracting certain diseases, I was able to log this information into the Icon Array Generator of VizHealth’s website. This provided me with a well constructed, easily digestible graph of the statistics that I had previously input. Below you can view the graphs that I (with the help of the icon generator) made to display the prevalence of Alzheimer’s disease (in individuals over 85), prostate cancer in men, and breast cancer in women.
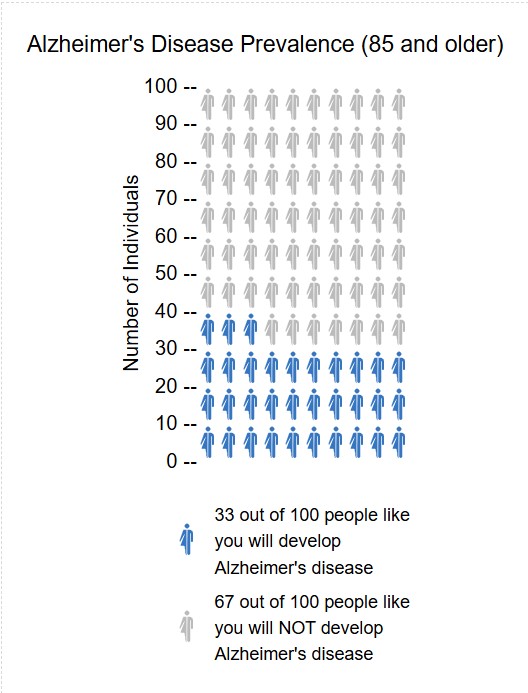
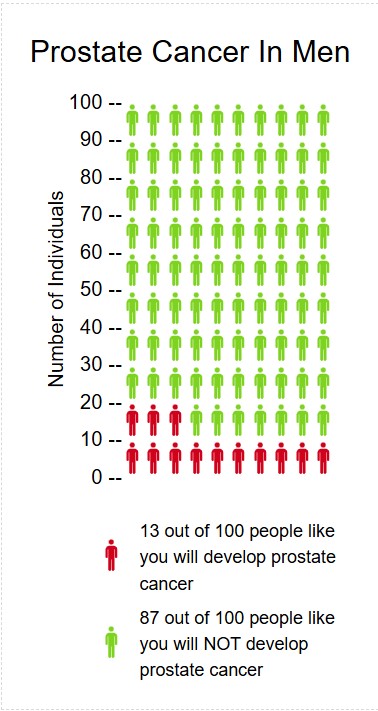
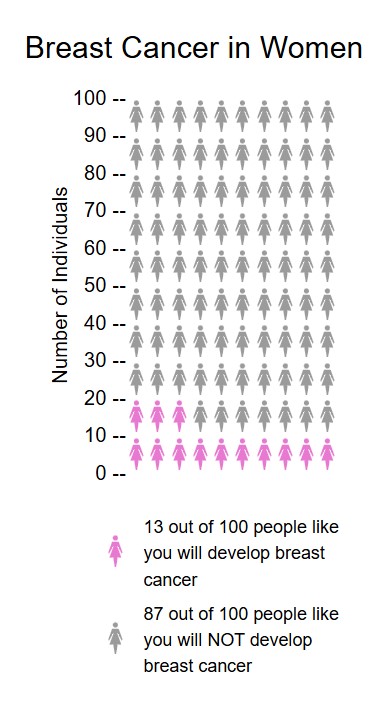
Through using this icon generator, I do believe that it is a useful tool to display variables that have an effect on the public. The ability to display icons in a male, female, or neutral way (with the availability to apply different coloration to the icons) makes VizHealth’s icon generator feature a personally customizable platform for the general public to learn more about how they can assess data.