Sports: Analytics or Talent?
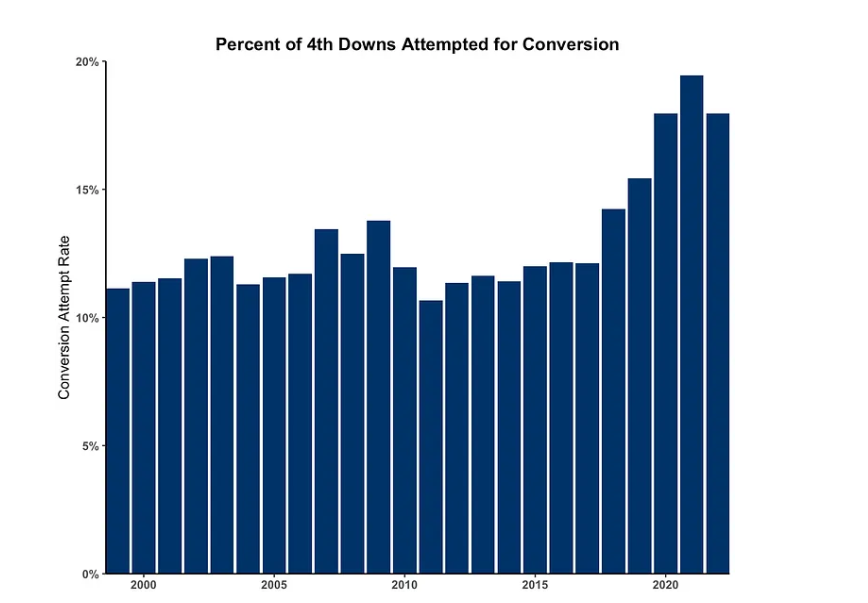
Sports management today is very different then it was in the past. A lot of in game decisions being made by coaches and managers is analytical driven based on probabilities and past results. Analysts have been employed by teams and have one responsibility, comb through the data and provide insight on when a team should make a decision based on probability not feelings. For example, the NFL has seen a surge in fourth down attempts. In 2000, NFL teams only went for it on 4th down about 10% of the time, in 2021 it was almost 20%!
This analytical approach was first attempted in 2002 by the Oakland Athletics baseball team’s general manager Billy Bean and assistant GM Peter Brand. Bean, a former player who knew that salary capacity played a direct role in how successful a baseball team would be was desperately trying to find a way for his small market team to be able to compete with larger market teams. Simply put, bigger markets paid more money to players and could build a more talented team. Peter and Billy developed a way to build a team of under valued talent in their scouting and analysis of players, popularized in the film Moneyball. This was the test of the theory that changed the landscape of professional sports as we see it today. Teams focused on data to not only evaluate players but how to manage games and seasons.
While the average fan won’t be making game time decisions that affect the outcomes of games they do debate who the best teams and players are. https://www.sports-reference.com/ , is a website dedicated to sports data and can be used to develop data visualizations to help fans win their arguments with their friends or make a case on why they believe their opinion on something is best. Whether you’re a fan, an analyst, coach or manager there is no denying that sports data plays a significant role in sports today then it did twenty years ago and the comparison of numbers plays a crucial role in sports today.
How Much Do You Save From Driving An EV Car?
Not only does driving an electric car decrease your carbon footprint, you also save a bunch of money! But exactly how much money should you expect to save? It’s about half as expensive based on cost to travel per mile according to my source.
EV Cost Savings
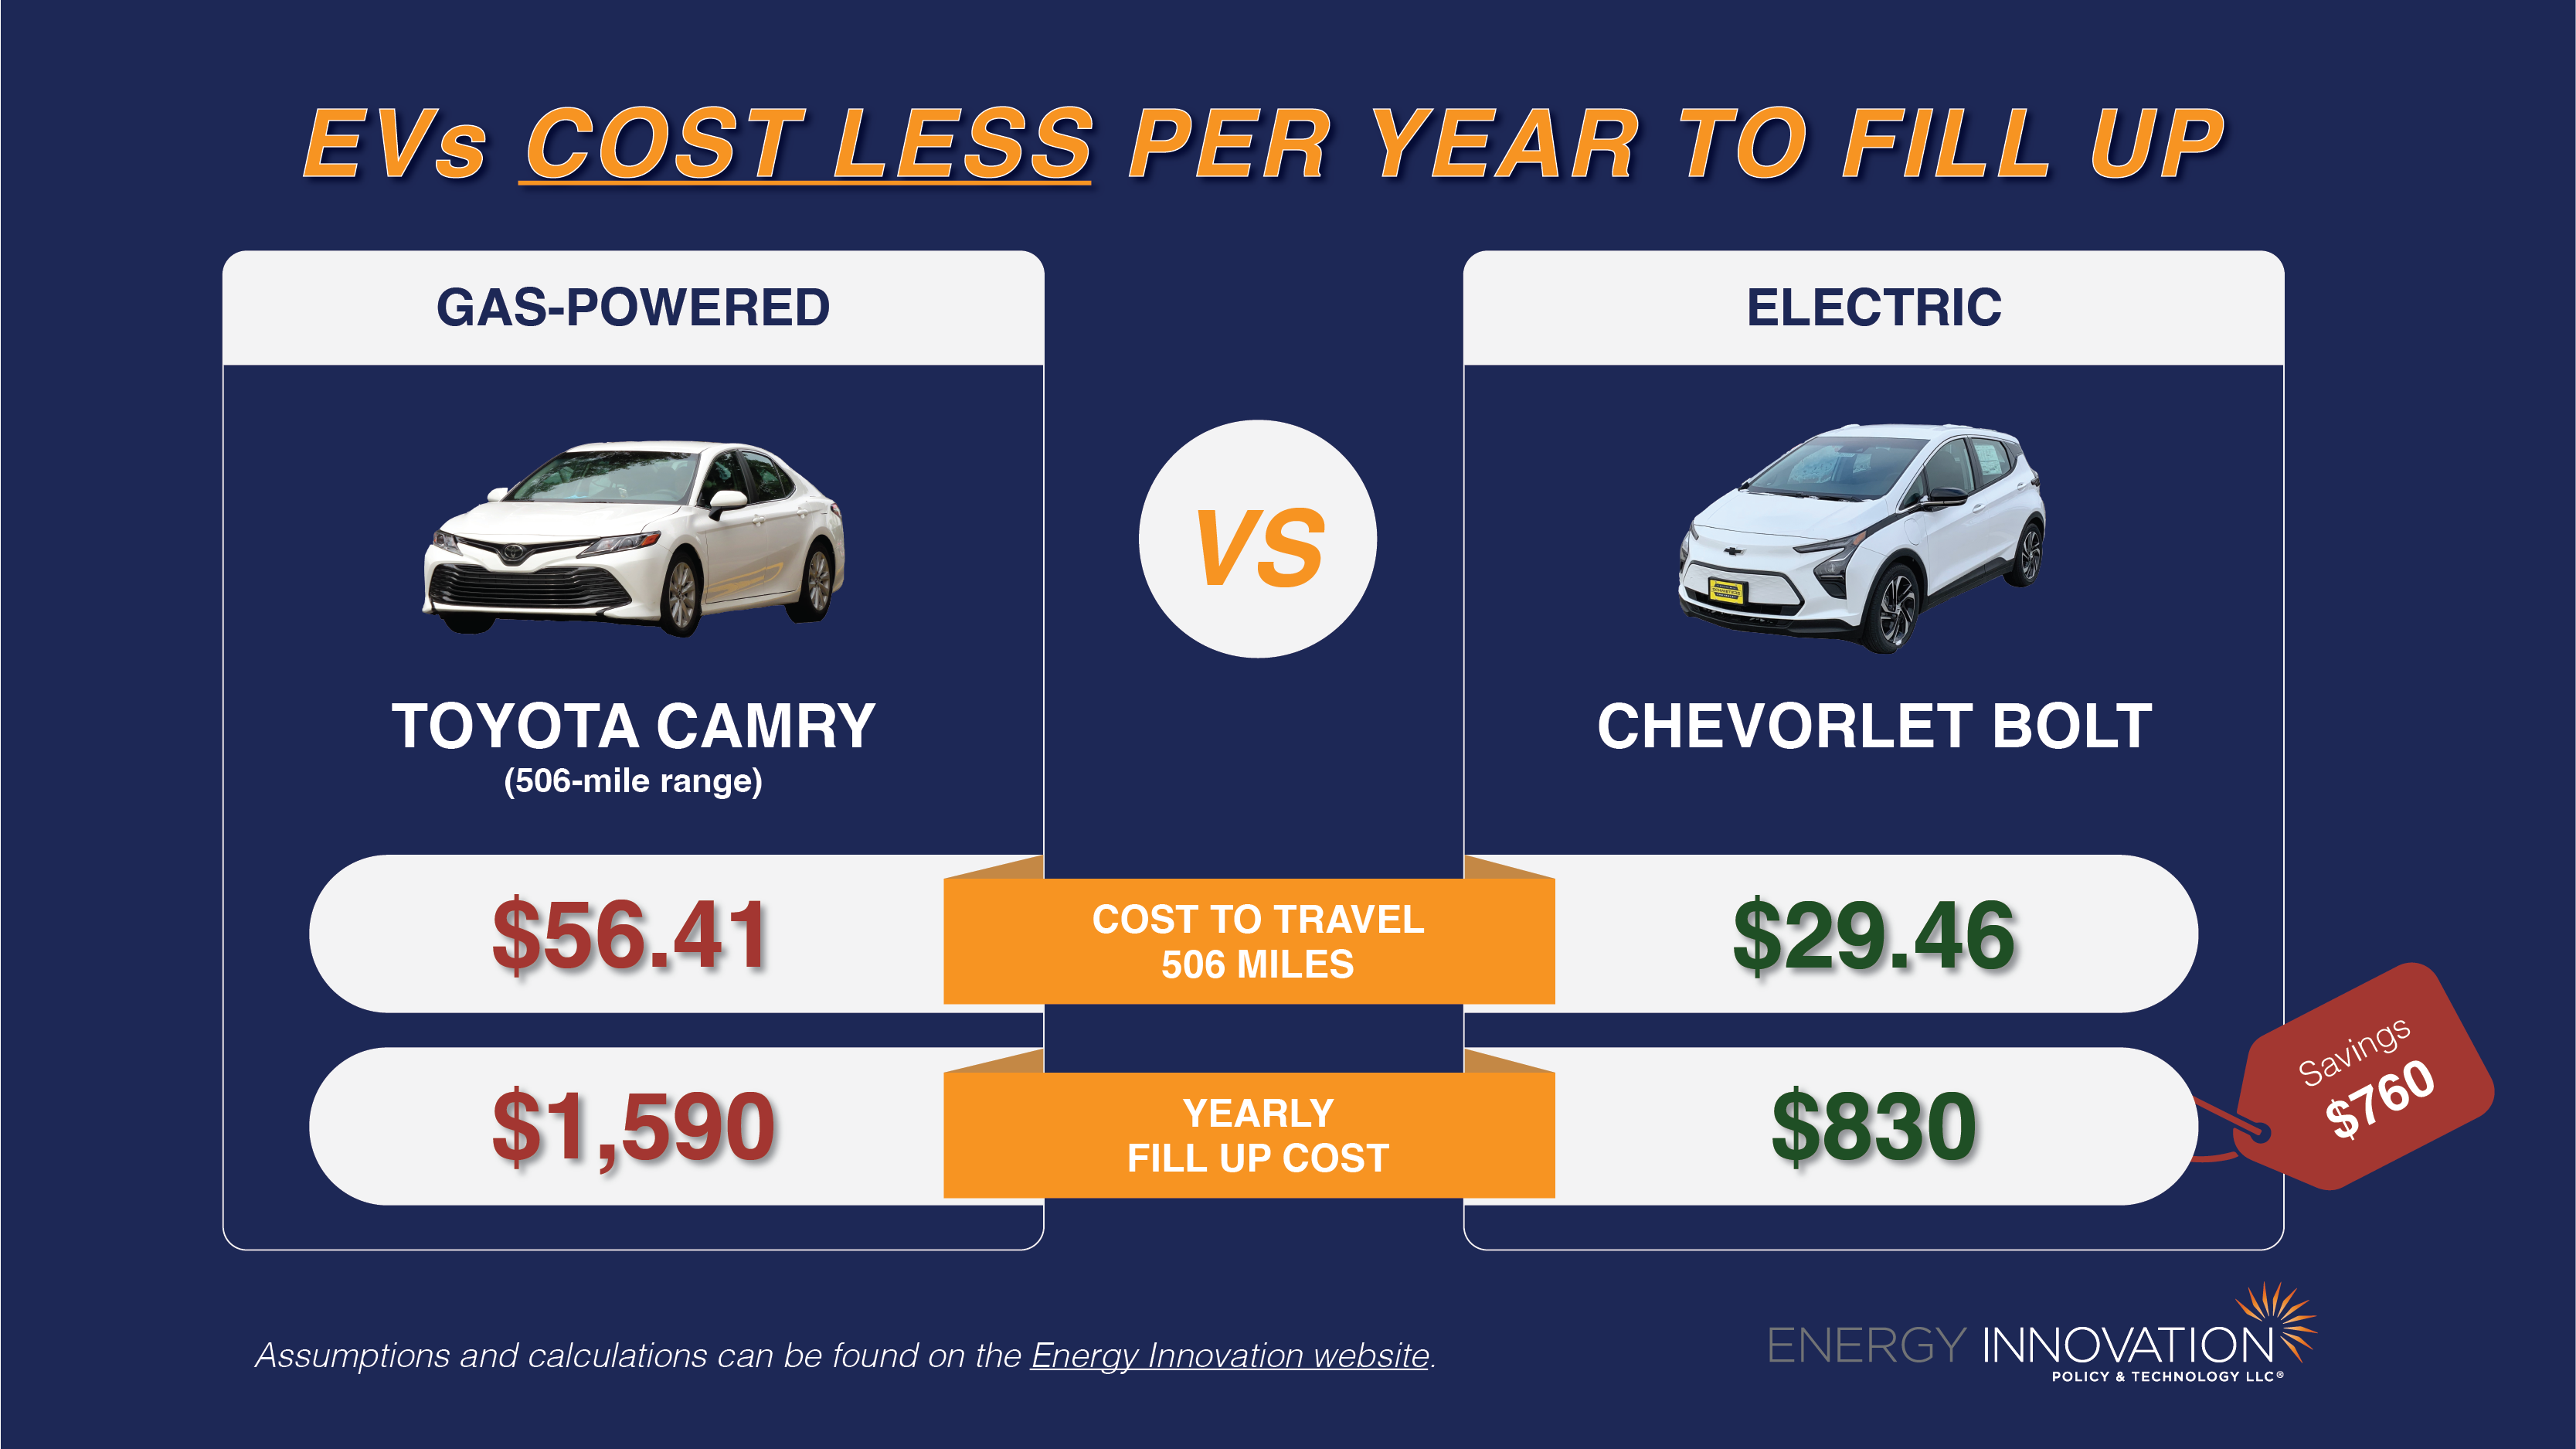
As seen in the image above, the cost to travel approximately 506 miles for a gas powered vehicle, in this case the Toyota Camry, is about $56.41. For the electric powered Chevrolet bolt, the cost to travel is $29.46. This is about $26.95 in savings. This means that you are almost able to drive 1000 miles with the same cost as the Camry’s $56.41 for one tank. This money adds up to a noticeable difference. The yearly fill up cost on average for the gas powered vehicle is approximately $1,590, whereas the electric is at a frugal $830. This saving is $760! Based on my calculations this is about a 47% savings per year when switching to electric vehicles. This is solely based off of traveling costs, so this excludes oil changes, other maintenance of gas powered vehicles that electric vehicles do not have. Overall, the savings from driving an EV car are significant.
Using Data Visualizations to Compare Numbers of Significance!
When trying to disseminate information to a group that doesn’t share the same level of expertise you or others may have, it may be difficult to get them to understand the severity of some statistics. For example, if you do not know anything about hockey, but I told you that Wayne Gretzky scored 92 goals within one season, you may think that sounds great, rather than amazing. But, if I prefaced that information with the fact that many hockey players would be considered of an ‘above-average’ or even ‘great’ skill level if they score above 20 goals in a season, you would begin to realize just how different of a player Wayne Gretzky was from the average superstar. The same concept applies to creating data visualization charts when comparing numbers of significance.
Read More about Gretzky’s Career: Westport Library: Using Data Visualizations to Compare Numbers of Significance!
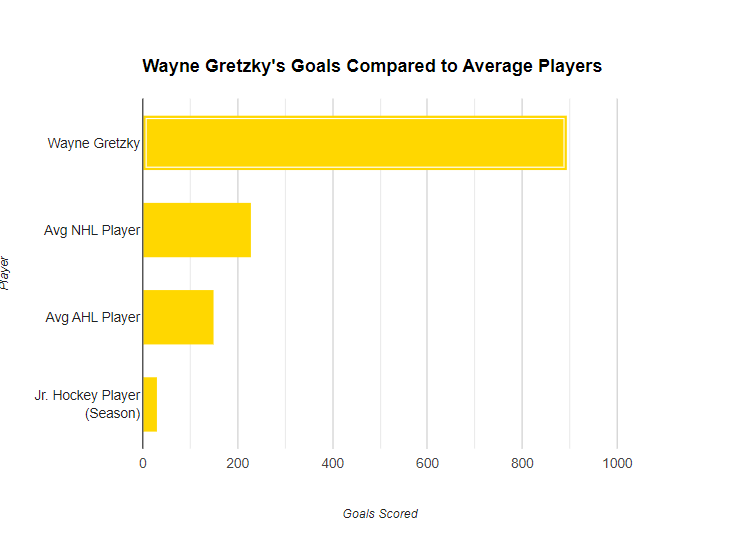
Within this bar chart, we can see the goals scored throughout someone’s career compared to Wayne Gretzky. By translating this information into a visual object, it is much easier for someone to grasp the magnitude of just how good Wayne Gretzky truly was as a hockey player. While my example revolves around just this hockey player, the concept of translating complex numbers and data statistics into data visualizations is the same everywhere!
Something unbeknownst to most people in New Jersey is that our state was responsible for growing 849 acres of eggplant in 2015, which has grown every year! Going off of a data point from 2015, this is what our eggplant production was like compared to the rest of the world at that time:

As you can tell, New Jersey was at one point responsible for well over two-thirds of the world’s eggplant production! Of course, this was taken at a point in time where our state was primarily responsible for supplying the world with the vegetable everyone loves. But, when comparing these two monumental figures side-by-side, the reader can better understand how the numbers fare up against each other. By New Jersey planting 849 acres, we produced an insane amount of eggplant which equated to roughly one million metric tonnes!
Data Visualization: Comparing Numbers
Data visualization is a powerful way to compare numbers and identify trends. There are so many different ways in which to do this. You can use Bar Graphs, Pie charts, Donut Graph, even line graph. It is important to FIRST thing about what exactly you’re comparing. If you’re trying to compare a significant amount of data maybe a Bar Graph is best so it doesn’t come off too congested. If you only have say 3 or 4 values to compare maybe a Pie or Donut Graph would be the way to go. If you are displaying data density change in data over a specific time a line graph might be best used.
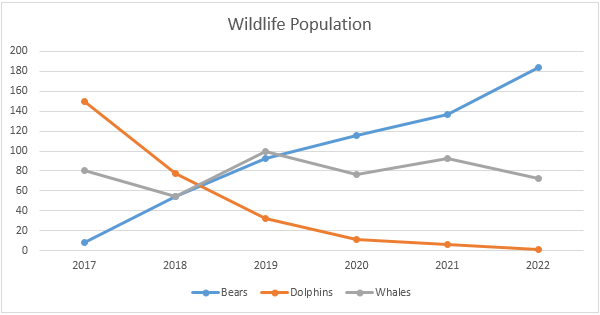
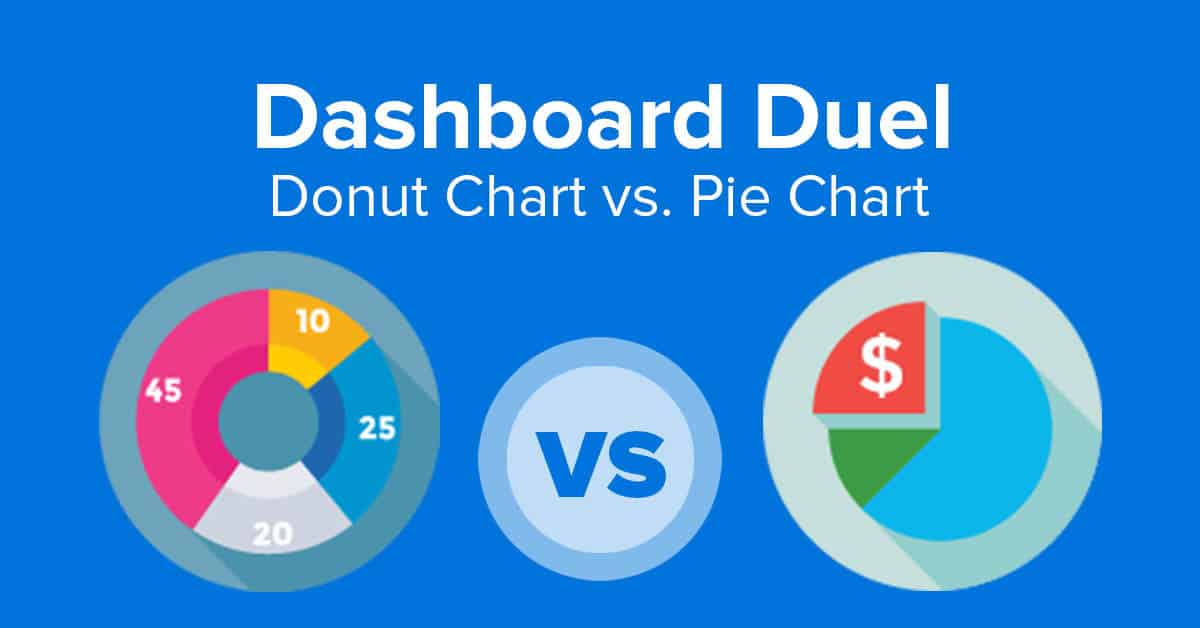

It is SUPER important to always make sure you are presenting your numbers with clarity though. Adding in the use of colors and labels can make a big difference to the human eye and mind in deciphering what item is represented by what value. The legend on the side of the bar graph for example clearly uses “green for boys” and “yellow for girls” when comparing their hobbies versus the percentages.
check out this link below for a more thorough breakdown on data visualizations and which ones are best used for comparing certain types of data and numbers.
18 Best Types of Charts and Graphs for Data Visualization [+ Guide] (hubspot.com)
Tools for Constructing a Good Infographic
An information graphic is an assortment of graphics, data visualizations, and brief text that provides a clear summary of a subject. Infographics are easy to make and are the perfect balance when dealing with an abundance of information. In this blog post I will show examples of good infographics that provide a clear message without overloading information.
Clicking on the Infograph below will take you to the website where I found it!
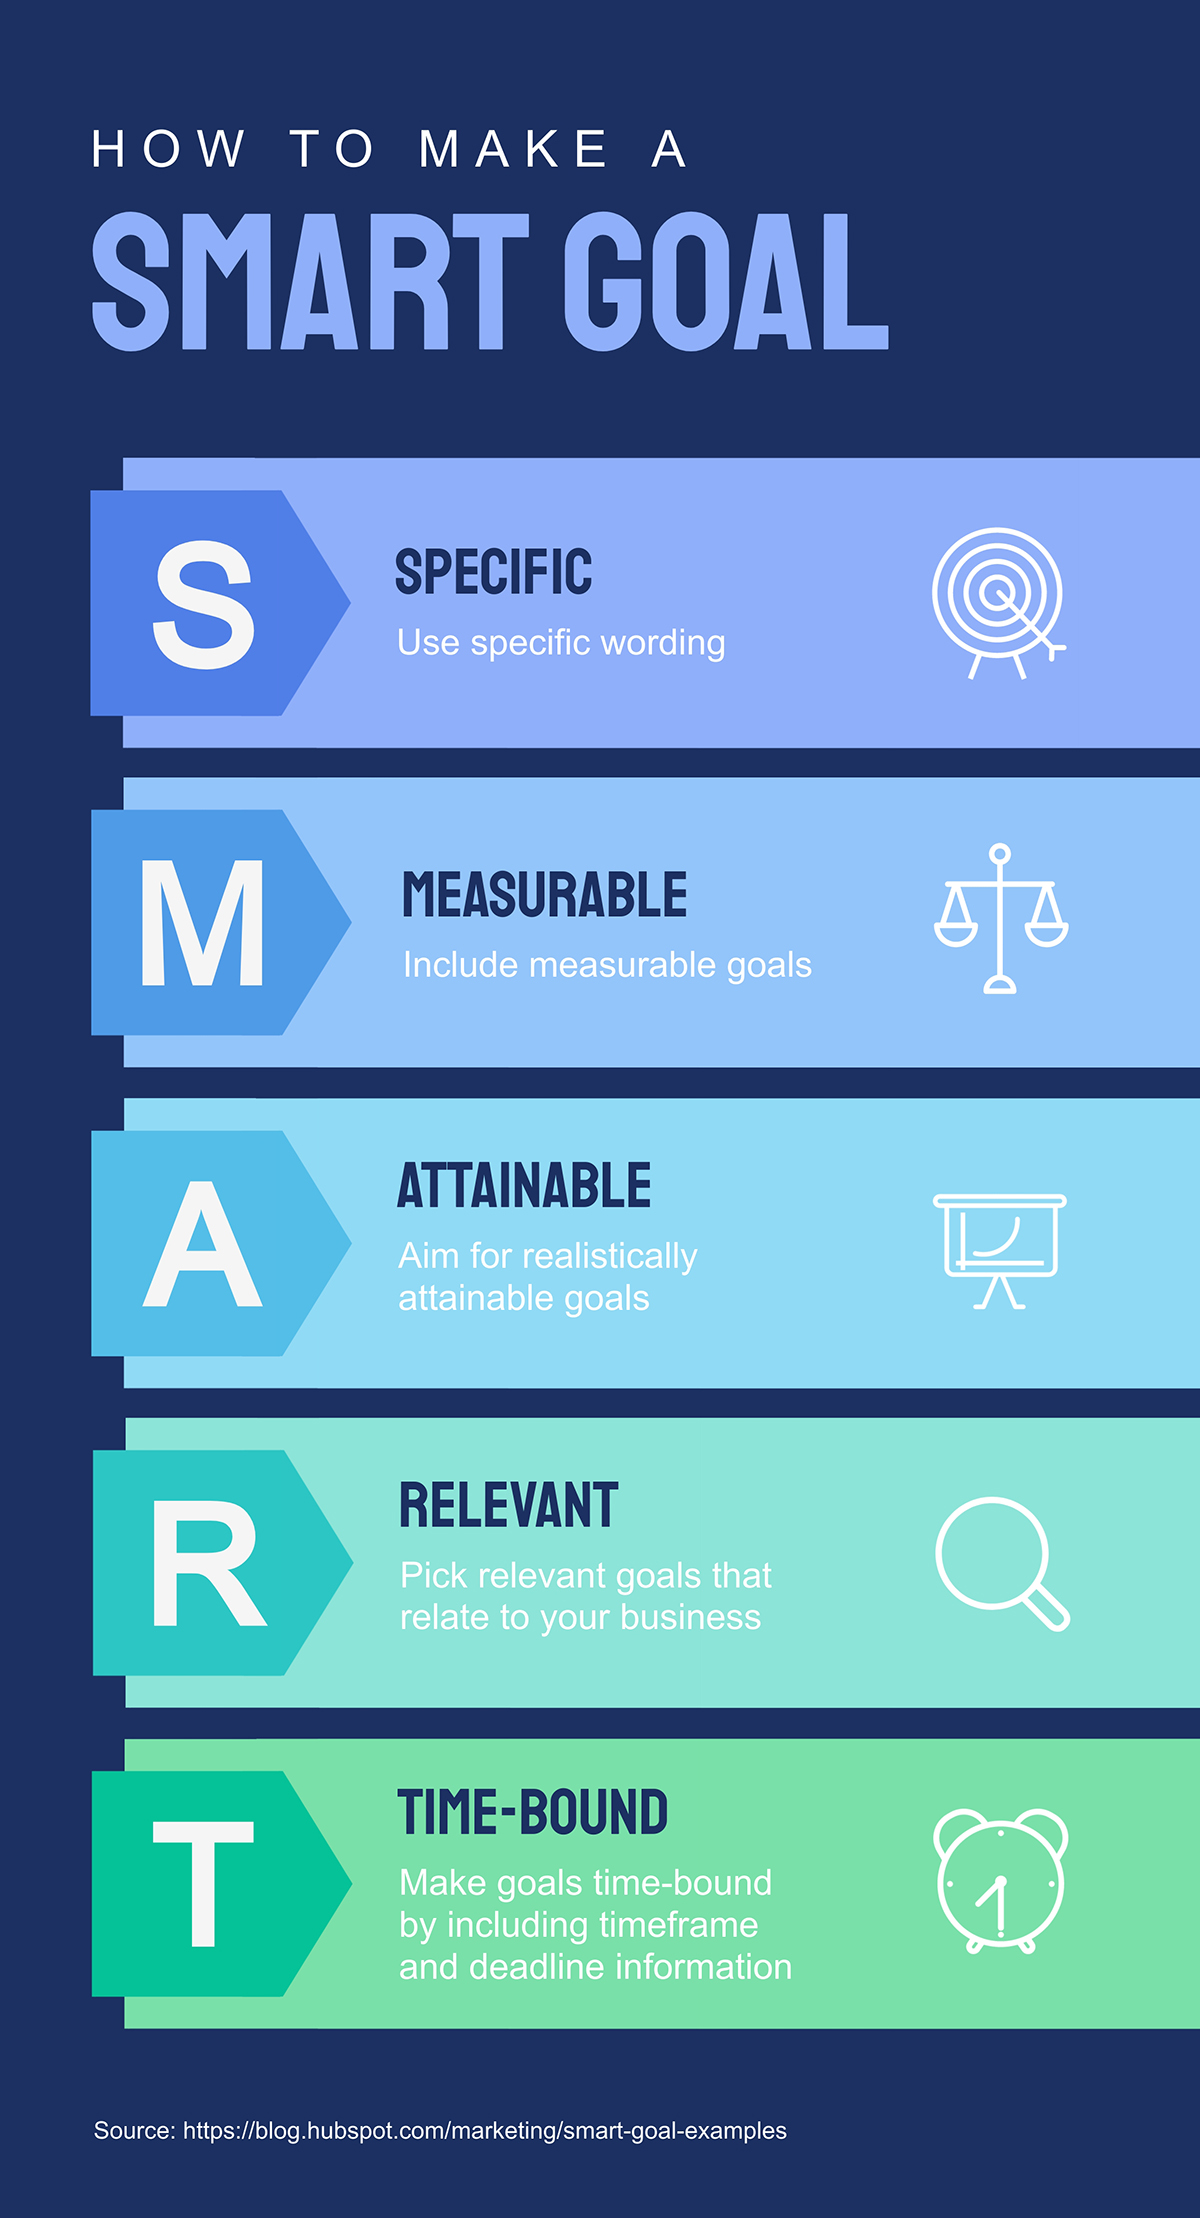
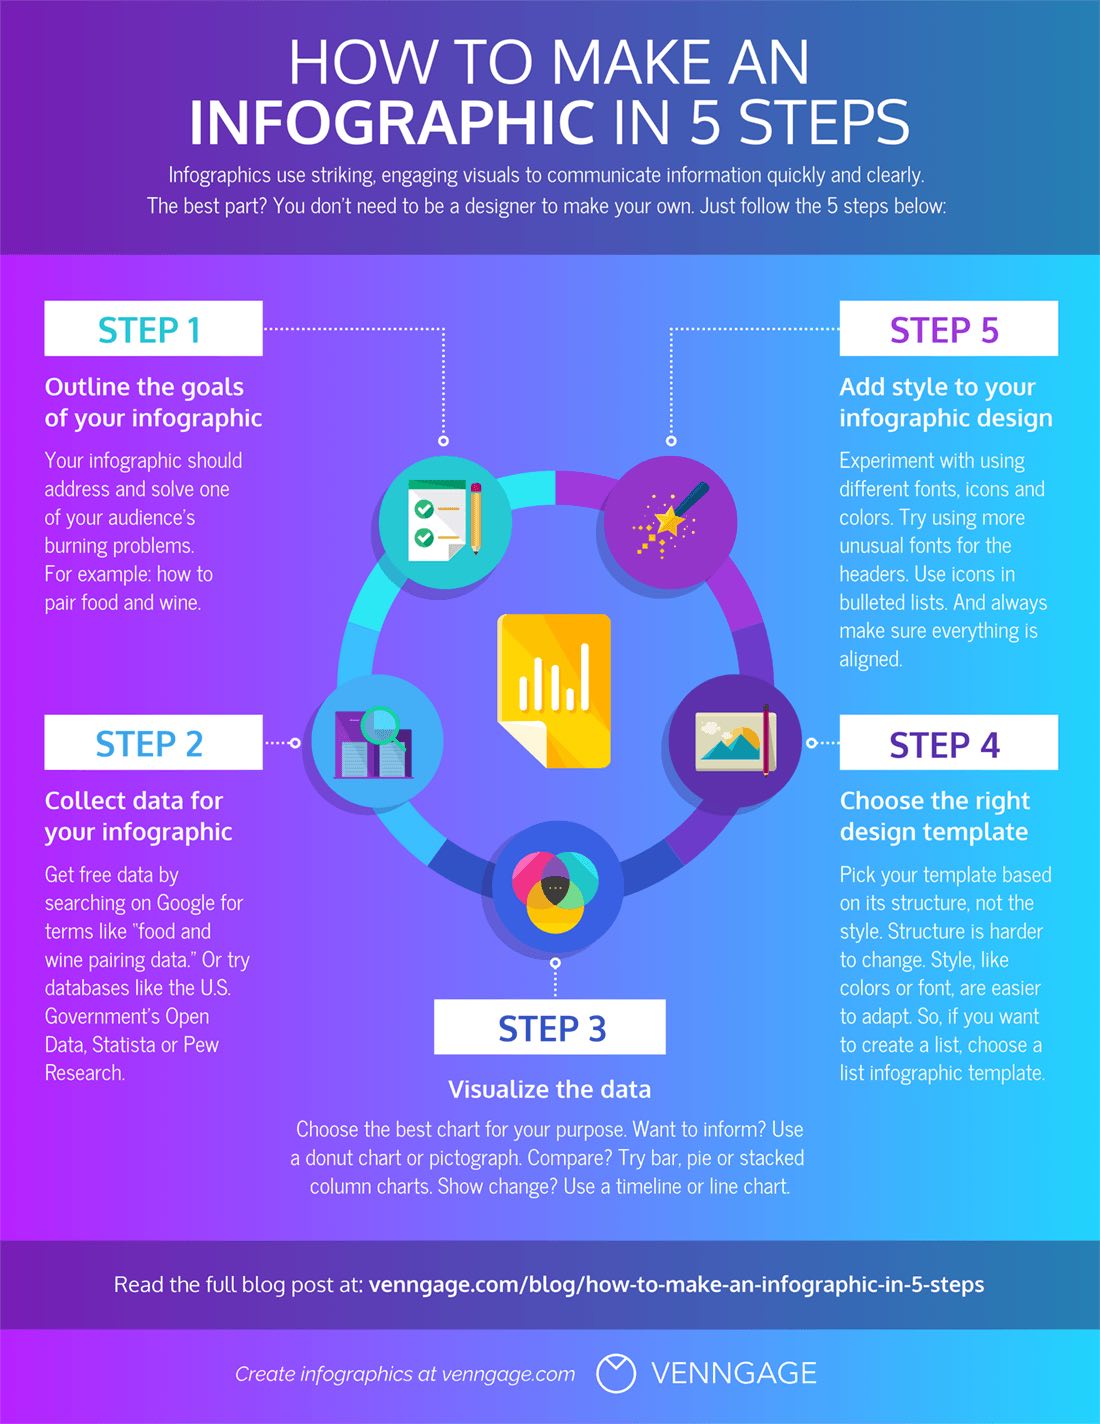
Infographics may be used for many purposes. You may share them on social media and post them on your blog. When creating an infographic, there are several internet resources available to assist. During this procedure, there are few stages that you should not skip. Creating an infographic outline, selecting a template, and adding your own customizations to your infographic are all important steps in creating a useful infographic.
Clicking on the Infograph below will take you to the website where I found it!
Sources
Health Visualization
The goal of visualizing health is to provide health professionals and other individuals who are interested in educating the public about health risks with direction and motivation. Widespread usage of this material has made it easier for medical professionals to communicate complex ideas to individuals who need clarification. There are many great options for presenting health data in Visualizing Health. Maintaining and improving health visualization is crucial for scientists, designers, and other experts. Websites like vizhealth.org can be helpful tools to use when visualizing health data.
On the left is a graph that shows how this website is a great tool for visualizing health. Being able to visualize medical data helps us to quickly understand our health. Diagnosis, statistics, and treatment plans can be difficult to understand without visual aids. It is important to stay informed when it comes to your health.
Using the Visualizing Health tool
The website titled “Visualizing Health” is a scientifically vetted tool created by the University of Michigan in order to help healthcare professionals and others alike to communicate data about health. It contains graphic displays of health data through different types of visuals and imaging. It’s goal is to assist audiences in making informed decisions about their health, and also helps aid healthcare professionals in their efforts to seamlessly communicate health risk information to the public.
The website makes it accessible and shares an easy-to-use guide on how to create data visualizations. Below, I have made one as an example based on information from the World Health Organization. This is one of the many ways these tools can be used to communicate data to an audience.
Visualizing Health
Upon navigating throughout the website, the importance of the tools and calculators on this website became apparent. I started at the risk calculator, where you enter different demographics that will compute your risk of cardiovascular disease based on the Framingham Health Study. Although this calculator may not be accurate for everyone, it provides an estimate that could be used as a baseline for your health. A tool like this could be used as an awakening for someone; Someone who enters their data and realizes that they may be a high risk, may decide to change their lifestyle.
Here is the visual and data I received after entering my demographics.

As you can see, based on the risk calculator my likelihood of developing a cardiovascular disease in the next 10 years is about 2%. I then used the icon array to put more perspective on my data.
This visual shows the percentage of people with similar demographics as mine that would be likely to develop a cardiovascular disease within the next 10 years (out of 100).
Like I said before, this tool can be used as a great estimate for people’s health. Overall, I believe this website is a step towards modernized health support.
Visualizing Health

Using the VizHealth website helped me understand how to visualize graphics better and with this experience, got me a new tool to help in providing information or data the correct way. Above in the figure, is my take on an icon array. I did not know they called them this and didn’t even know what it was until I saw it. This figure above is only an example and does not with real information. It is just an example of an icon array and if you go to the website, you can also see how to do this type of graphic. With this, you can change however you want and use any information you want. I think this site is very valuable for learning about data visualizations because of how you can learn through doing it. It is not just a website that has you reading, it gives you tools to help you understand and you can do it yourself and learn how to create a data visulization.
Exploring Viz Health
Vizhealth.org is a dedicated platform that specializes in the visualization of health data, aiming to enhance the accessibility and comprehension of complex health-related information. The website offers a variety of tools and resources designed to assist users—ranging from healthcare professionals and researchers to educators and the general public—in creating clear, engaging, and informative visual representations of health data.
By leveraging advanced visualization techniques, Vizhealth.org enables users to transform raw data into intuitive graphics, charts, and interactive dashboards. This not only aids in the interpretation of intricate datasets but also facilitates better communication of health trends, outcomes, and statistics to diverse audiences.
After messing around with their Icon Array tool, I can conclude that I found this tool and whole website in general very helpful. It is an valuable resource for putting information together into a visual. When data is presented in charts or graphs, it becomes clearer and more engaging, allowing viewers to quickly grasp trends and patterns. This visual representation can also make it easier to communicate findings to others, making discussions more effective and informed. For my visual I made, I just used some simple statistics on how many people out of 100 have a cellphone.