Home » 2023 (Page 12)
Yearly Archives: 2023
Infographic Design Tools: Canva
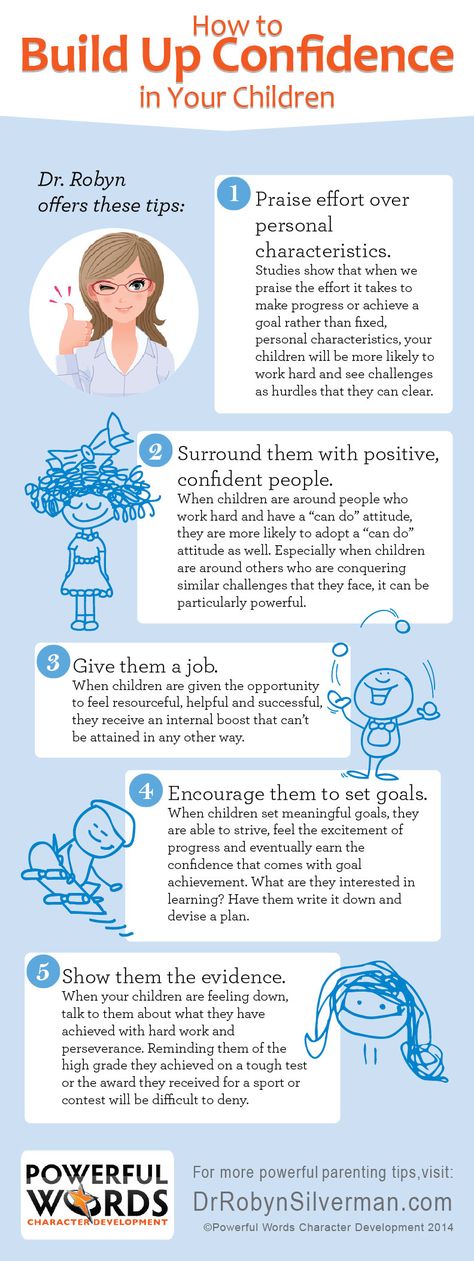
The following is an Informative Infographic that provides insight into how to build confidence in your children. The Infographic is well-designed and set up in an order that’s easy to follow. The design provides a perfect combination of images and color contrast, pleasing the eye.
Here is a link to the Infographic Image https://edmontonfetalalcoholnetwork.org/2015/05/28/confidence-building-in-children/
Sites For Creating Infographics
Sites such as Canva, Venngage, Infogram, Piktochart, Vise, and others provide tips and templates for creating the perfect Infographic for your audience.
Canva
I will discuss Canva in more detail since it is an excellent tool for guiding you through designing your Infographic and offers a variety of templates and designs to choose from. The possibilities with Canva are virtually endless. You can select themes such as medical, mental health, science, health, environmental, etc.
You can even watch a video that demonstrates how to create an infographic by clicking here
Canva Infographic Maker
The Canva website also provides a one-page guide to making an Infographic. In addition, this includes information regarding their photo library, which contains millions of photos that can be used in your Infographic. You also upload your own photos to the graphic if you have your own graphics that you wish to use.
Infographics
By Shaun Sneddon
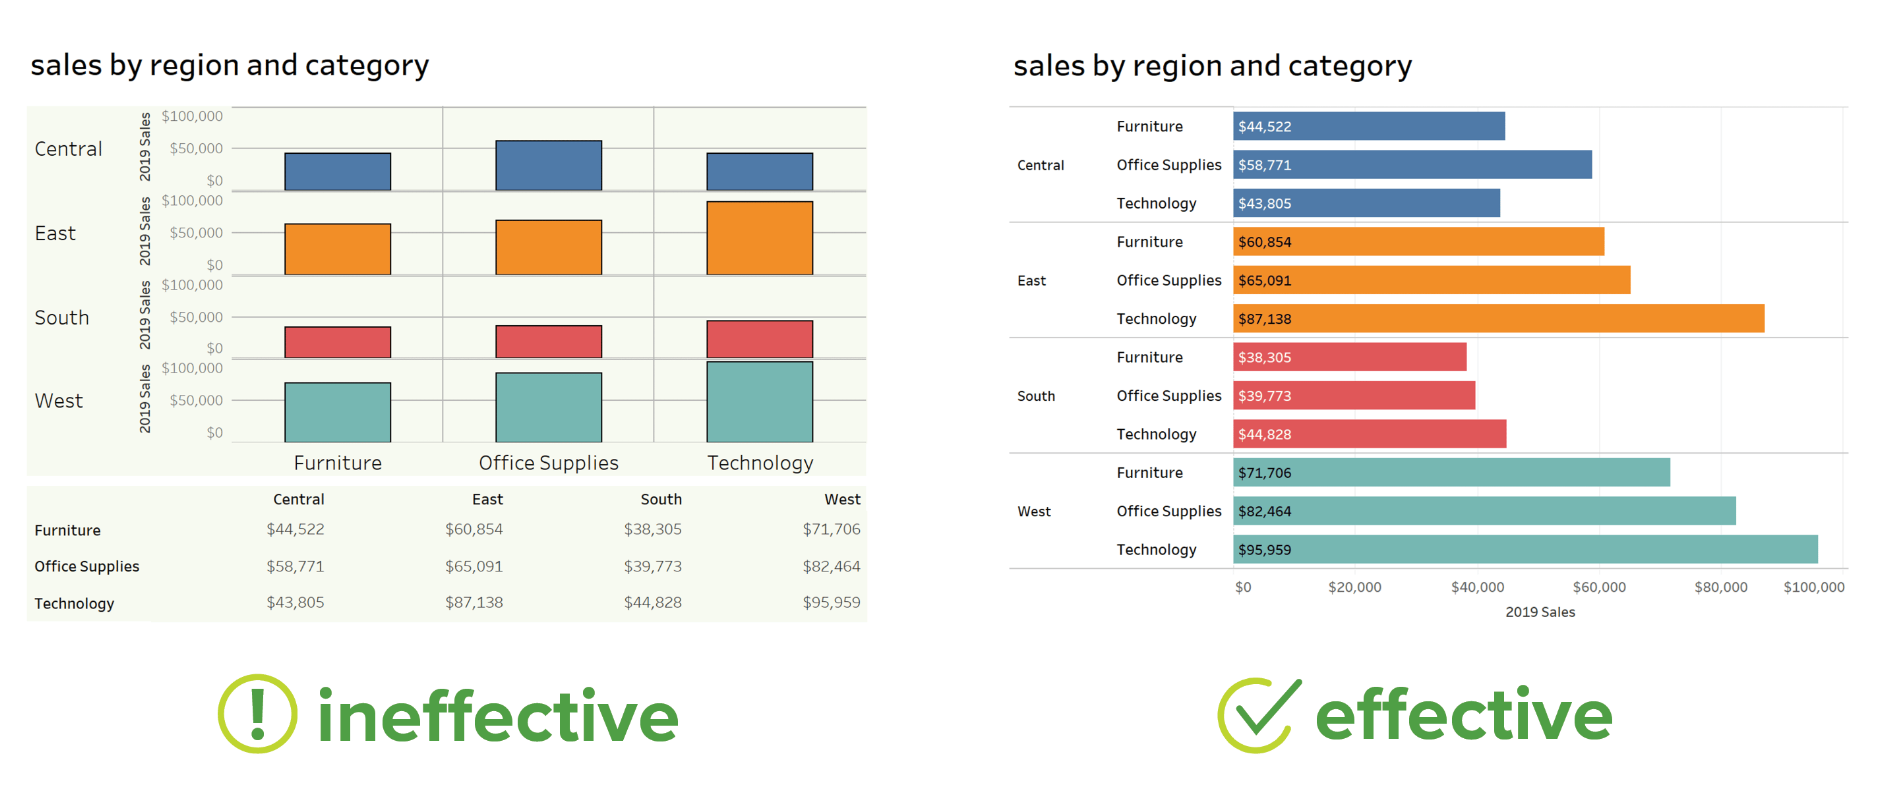
- Examples of insightful data visualizations:
- First example I found that very interesting because I do love Star Wars was a graph of all the characters (over 20,000) are connected.

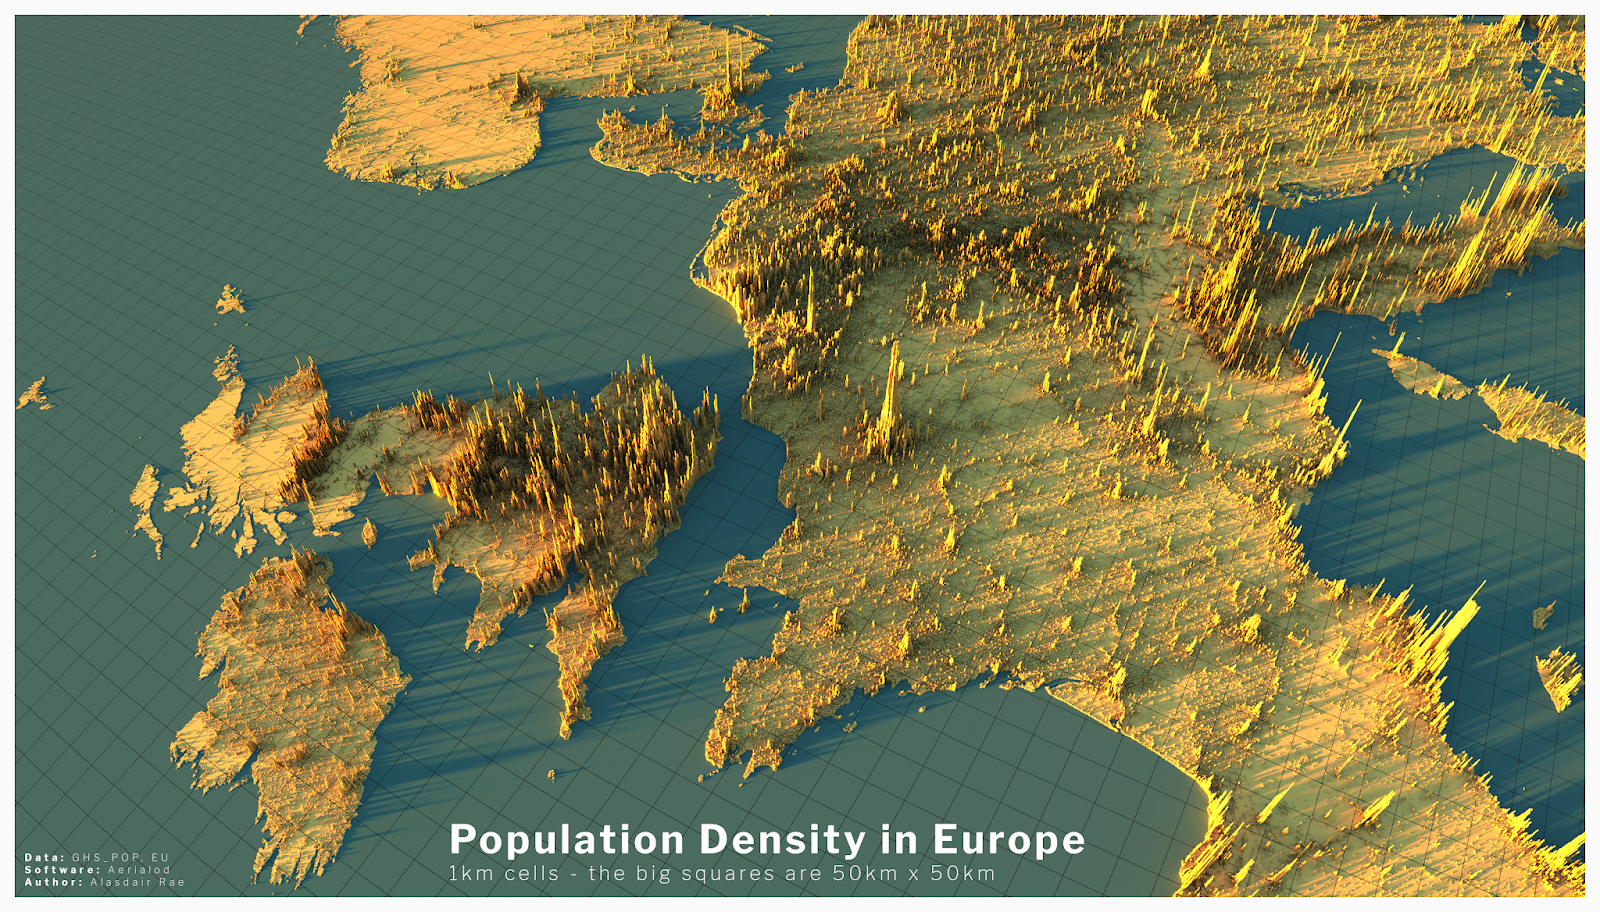
- The second example I found intriguing was a 3D data visual of where higher populations are located in Europe. When you look at a map of Europe you see the cities and can think that’s where a lot of people live but with this 3D visual you can see where people are vastly located.
- Example datasets for potential project use:
- Airline Safety
- Traffic accidents in a community
- Fatal Car accidents by country
- Stress at universities
- Tools that may help us construct Infographics:
- There is many websites that can help students construct Infographics such as Infogram, Adobe Express, and many more.
- Tools such as accessing data and images on the Internet.
- Website used for the images https://careerfoundry.com/en/blog/data-analytics/data-visualization-examples/
Welcome Fall 23 class
We will be posting our visualizations here each week. You can scroll through and see SOME of the past posts by students. Most of the previous class posts are password-protected, and I will release those at the end of the semester. I look forward to reading about your challenges and successes as you create your visualizations.