https://exceljet.net/articles/excel-pivot-tables
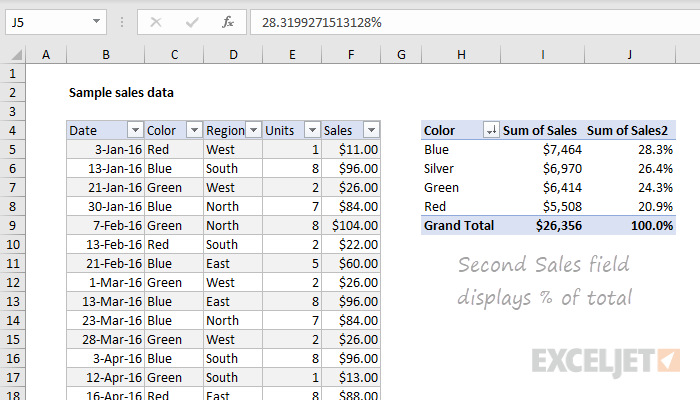
A pivot table can be used for a variety of reasons to portray data. A pivot tables usefulness truly comes to light when one has to summarize large amounts of qualitative/quantitative data. It can provide a flexible and efficient way to not only separate the data into individual rows and columns, but also make it easier to identify patterns, and trends that may not have been noticed. As shown by the data provided above by Exceljet, the pivot table ran automatic calculations on the summed/counted values and the data was segmented by date, color and other variables. Furthermore, with the information provided, the user can now calculate the percentage values of each calculation if desired. Lastly a pivot table is also very easy to create as well as understand. There is no need to learn complex formulas and one simply has to enter the data and insert the table or use drag and drop tool depending on what visualization tool they are using. All in all, pivot tables are a great way to organize data into rows/columns and simplify data.