Pivot tables are the best features in Excel. A pivot table is a powerful tool to calculate, summarize, and analyze data that lets one see comparisons, patterns, and trends in your data. Last semester I took a class in which I learned about pivot tables so I know how it’s work. A pivot table allows us to transform columns into rows and rows into columns. It allows grouping by any field and using advanced calculations on them.
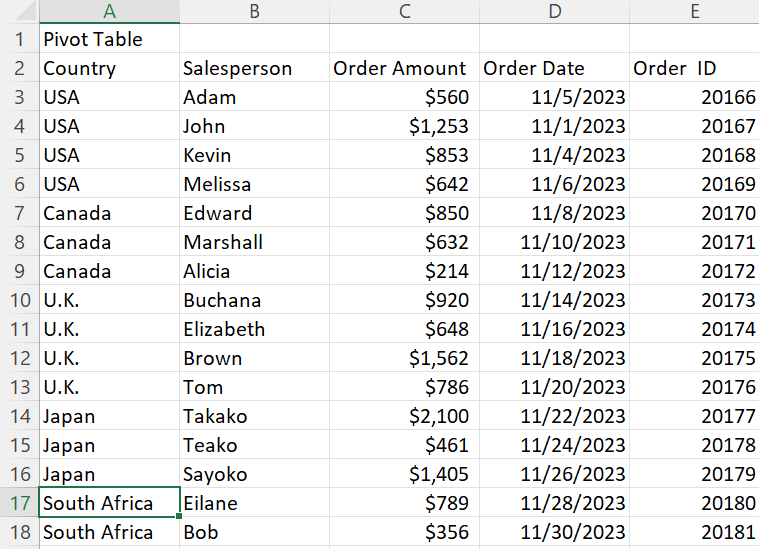
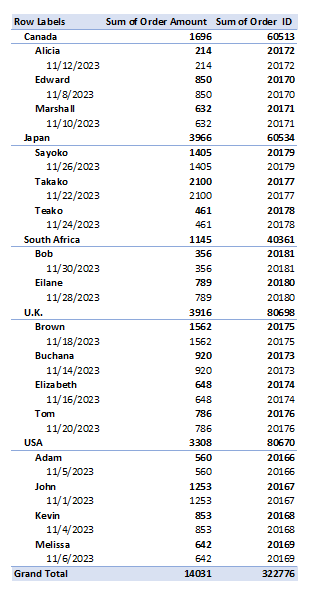
In the real world, you are working in a company and your boss gives the big data to analyze and do organization in an order. A pivot table is the key to that problem. I am going to present my example of the pivot table. Here is an example of the pivot table in which salespersons are in different countries for sales. Now, I want to organize the salesperson’s name based on their country with the order amount. With the help of the pivot table, it will be very easy.


In conclusion, a pivot table is the most interactive way to quickly summarize large amounts of data. The pivot table summarizes complex datasets into a table that allows us to easily find patterns or solutions to any questions we might have about the datasets.