So, the election date is coming up soon and I want to have an interesting topic that can be use with a Pivot Table. From what I understand is Pivot Table is used to summarize a long data set with multiple repeat data. What can be repeated multiple times and also related to the election date is the party and religious affiliation of U.S. presidents.
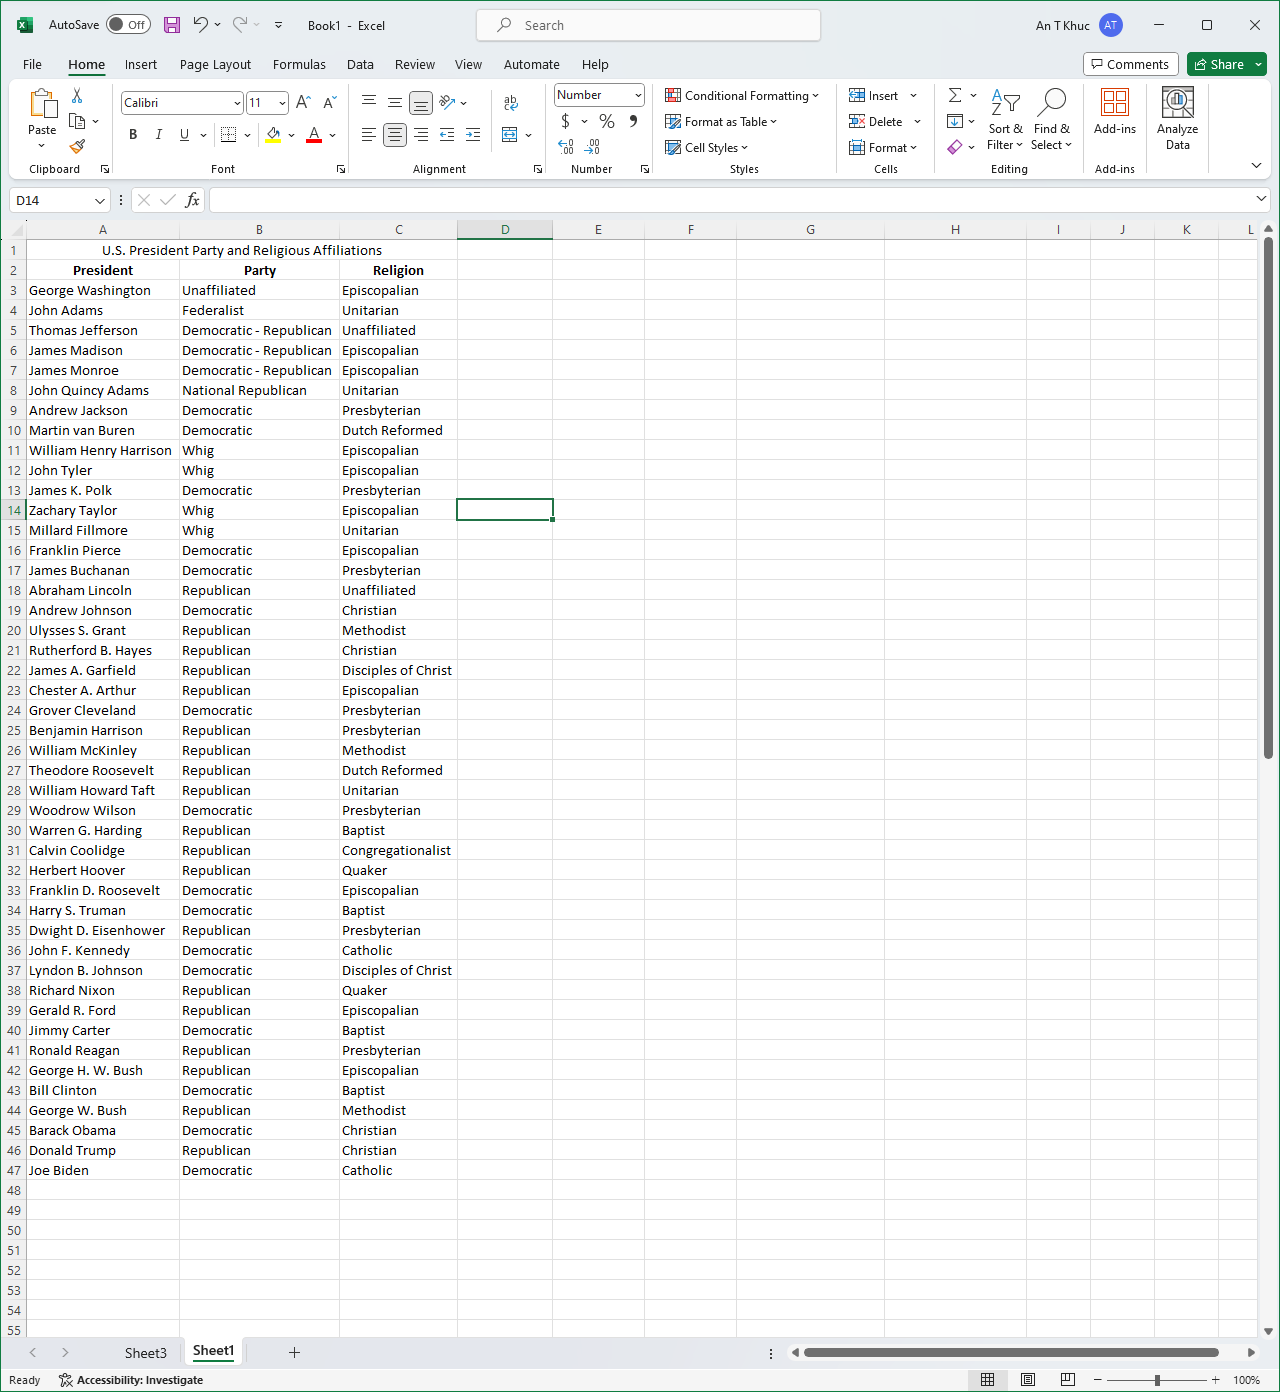
Here I written out a set of which president belongs to which party and which religion that said president affiliated with. It is useful in the case of “How many presidents is in this party?” or “How many presidents is following this religion?” because we have seen so many Democratic and Republican presidents from the past that we can’t easily summarize it by imagining it.
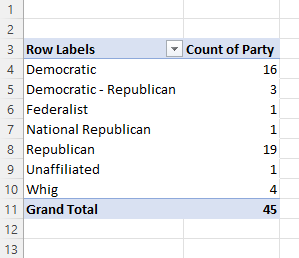
Using the Pivot Table helped sort out the total number of presidents belonged to any of the party and it can be vice versa to see how many presidents following what religion as well.
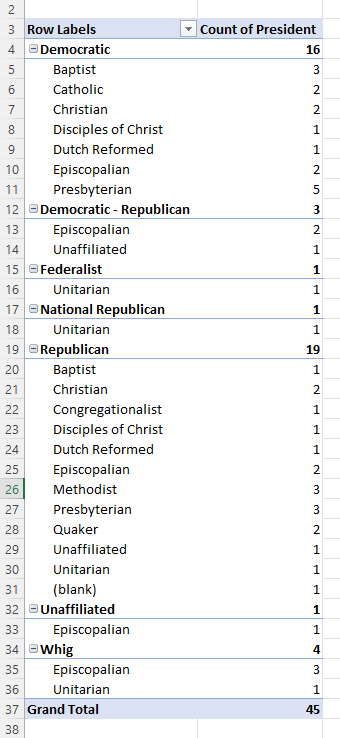
As you can see here is another interesting take on the Pivot Table. You can create a sub-topic and see which party is affiliated with which religion. It is entirely based on your need for what you can do with Excel, but another problem is how you create your table as well because I have not yet find a way to split party and religious affiliation into separate data set.